 Strategy Builder, BTCUSDT 4H: Builder
Strategy builder and backtesterBacktest it.
Then try
to break it.
Write entry and exit rules, run them over the bars on your chart with commission and slippage, then check the result on bars it was never tuned on. Pro plan, $30 a month.
One idea.
No code.
TradersWeek Strategy Builder is a backtester inside the charting terminal. You set entry and exit conditions on price and indicators, group them with ALL and ANY, and give the trade a stop, a target and a risk per trade. It tests on the bars loaded on your chart, and it never places a real order. It is part of Pro, $30 a month.
- From a preset40 to start from: Golden Cross, MACD Momentum, Keltner Squeeze Breakout, London Open Breakout, Divergence Hunter and 35 more. A preset loads as your own copy.
- From listsPick a value, a comparison and an indicator. Groups nest inside groups, so no code is needed.
- Around the newsSkip the bars around FOMC, CPI, NFP, GDP, ECB, and BoJ releases, or trade only near them.
- From a sentenceOn Premium, type the idea and an AI model drafts the rules for you to check.
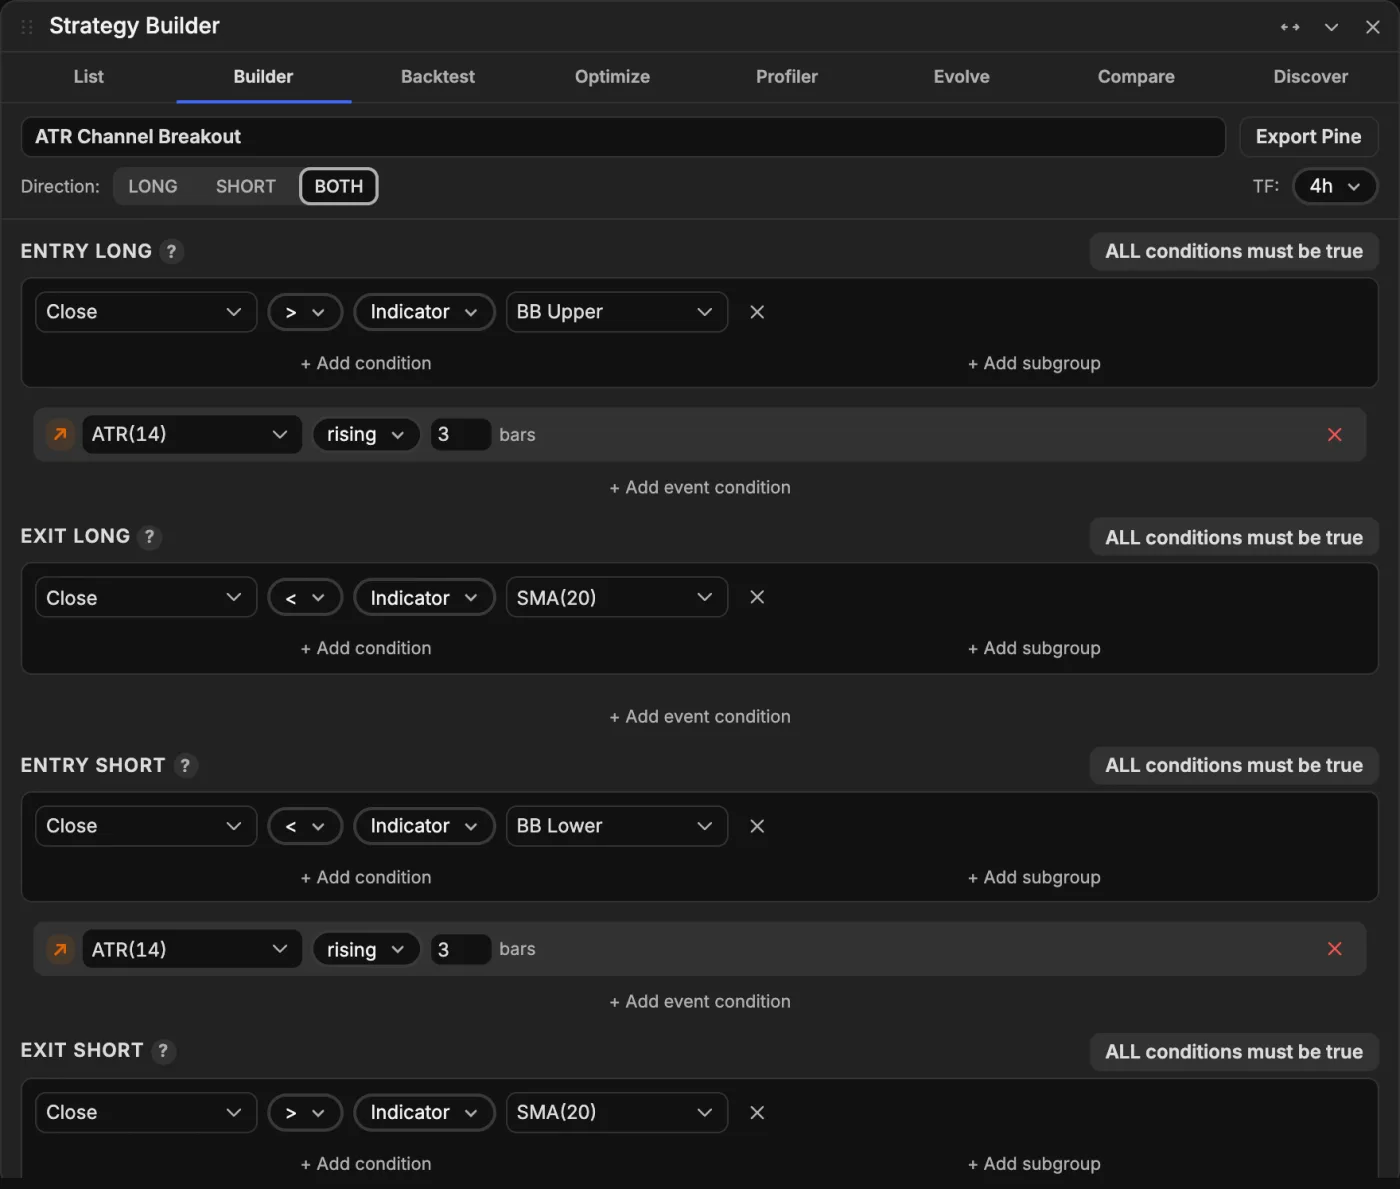
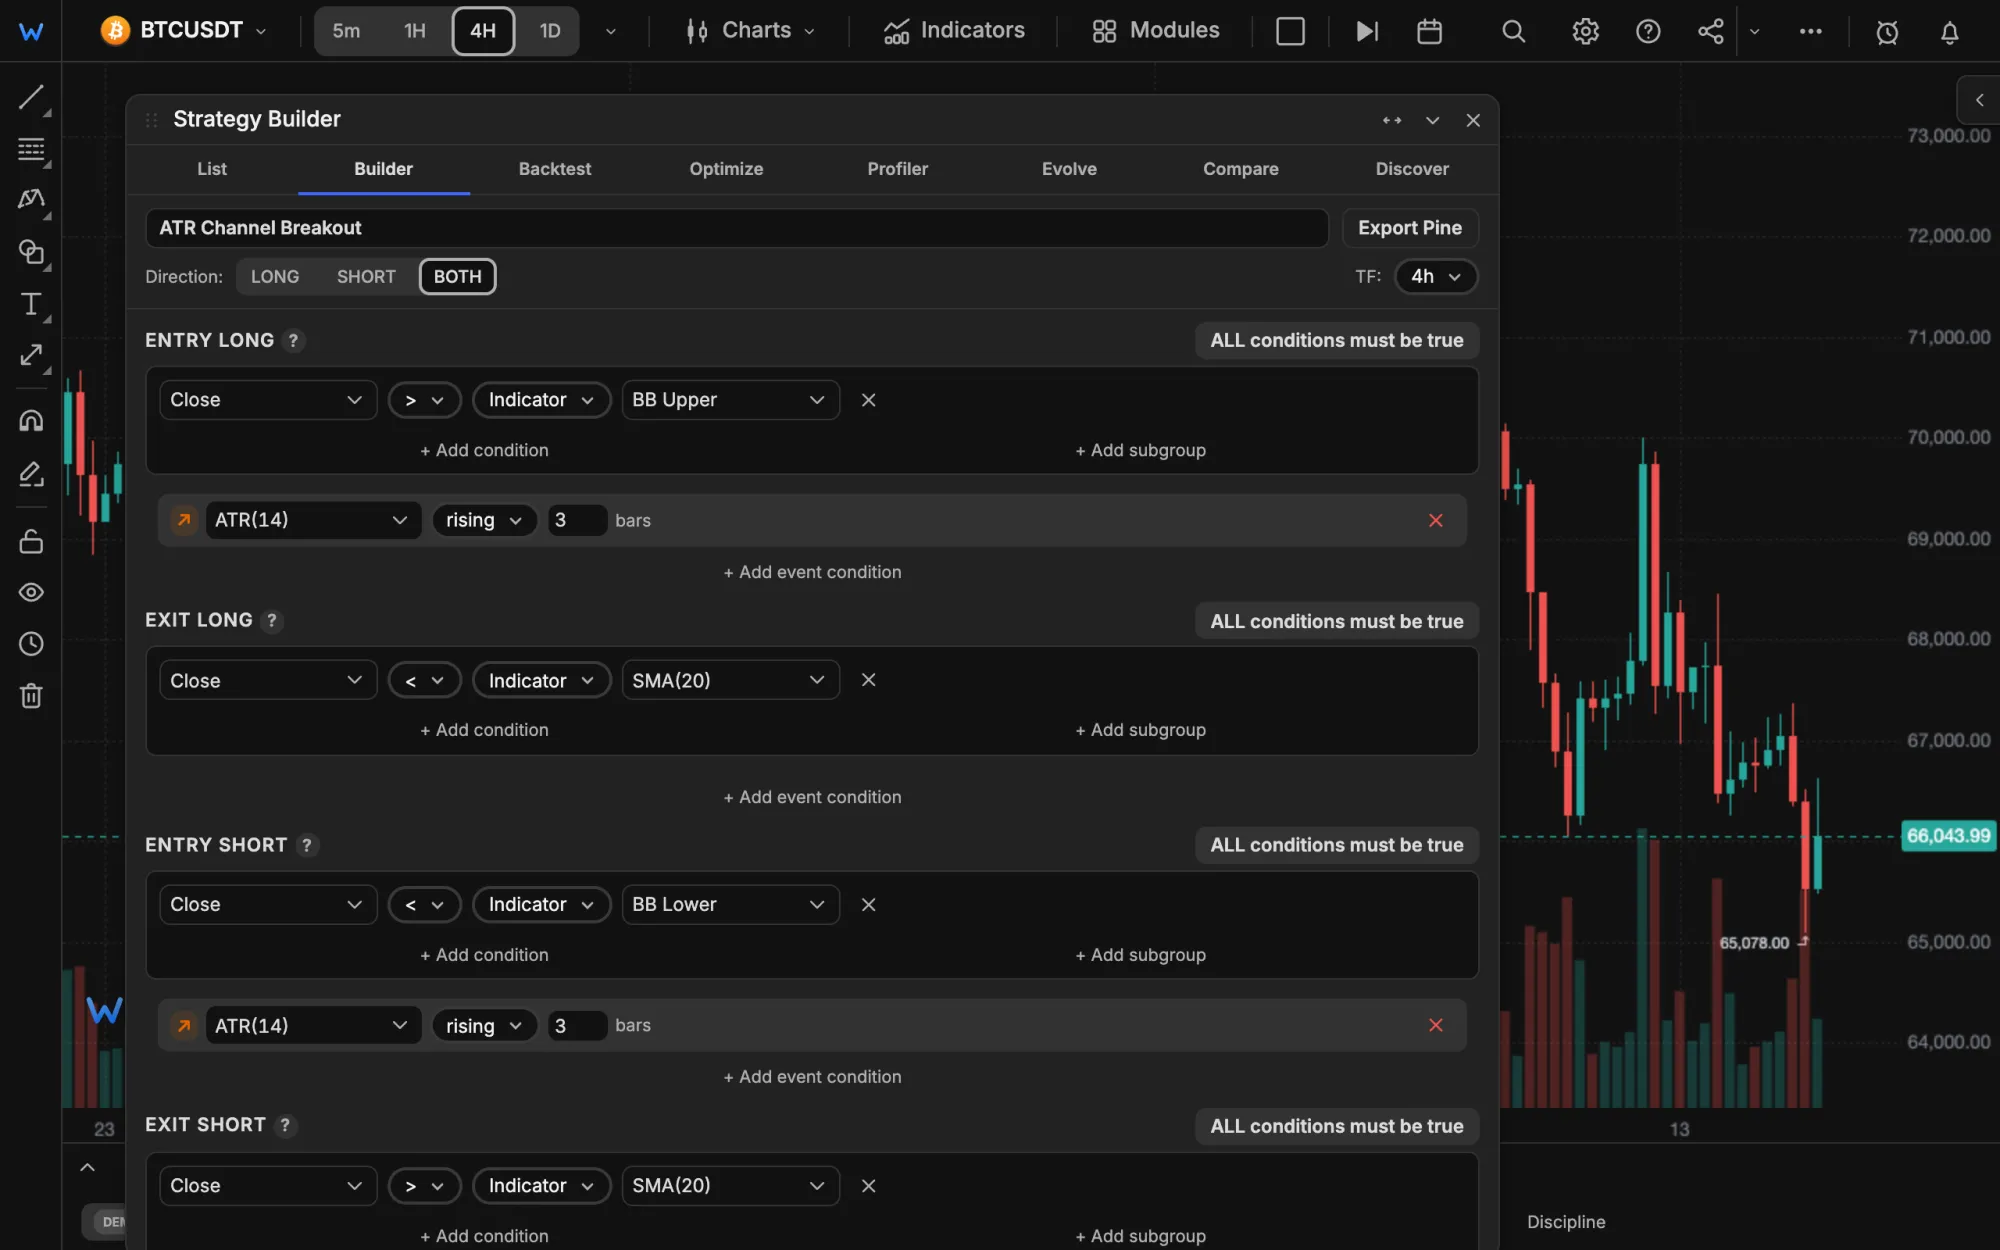
The idea on this page: ATR Channel Breakout. Buy when the close breaks above the upper Bollinger band while ATR has risen for 3 bars, exit on a close below SMA 20. Shorts mirror it.
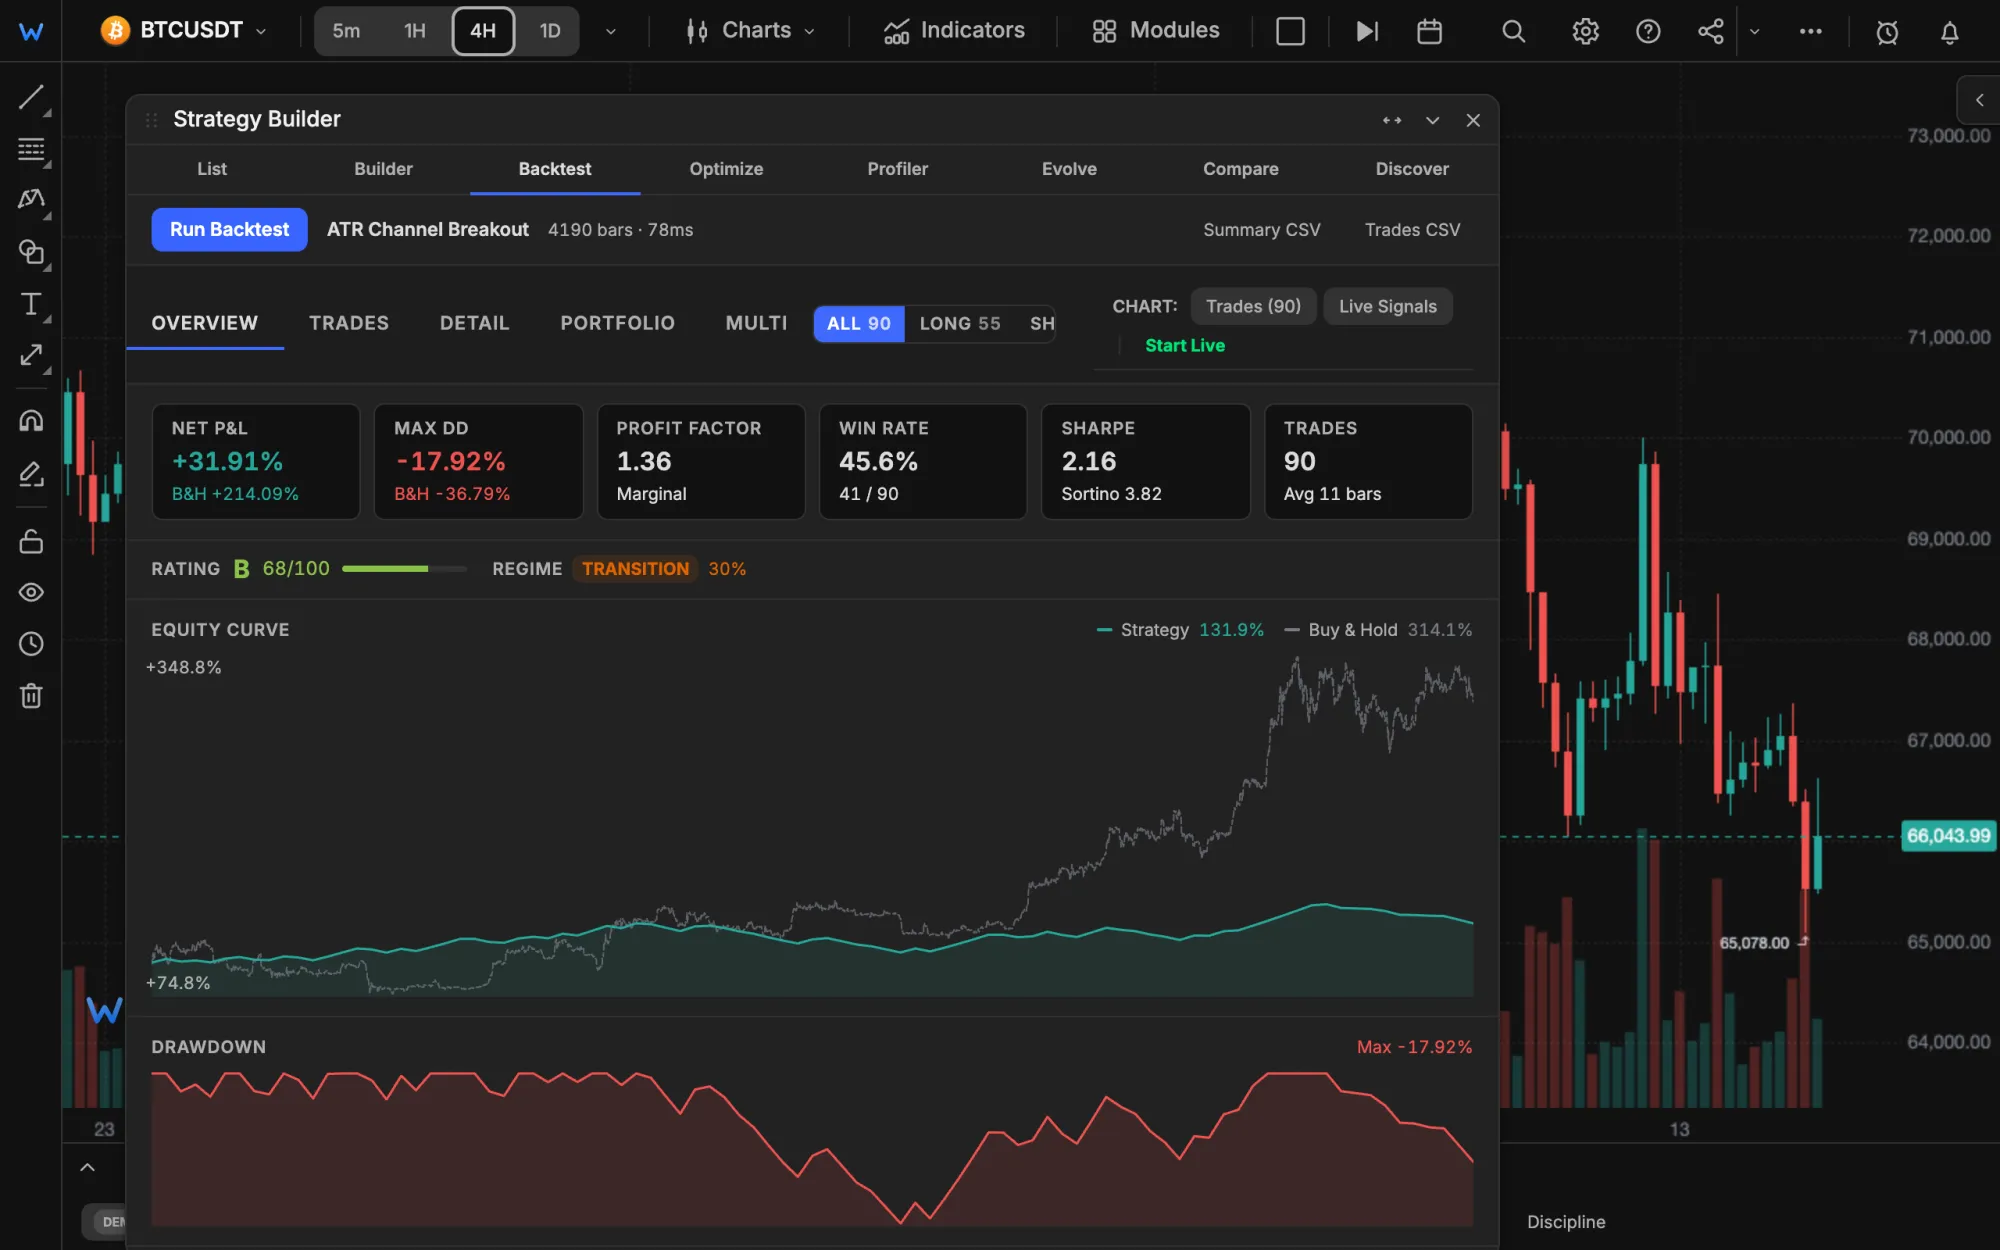
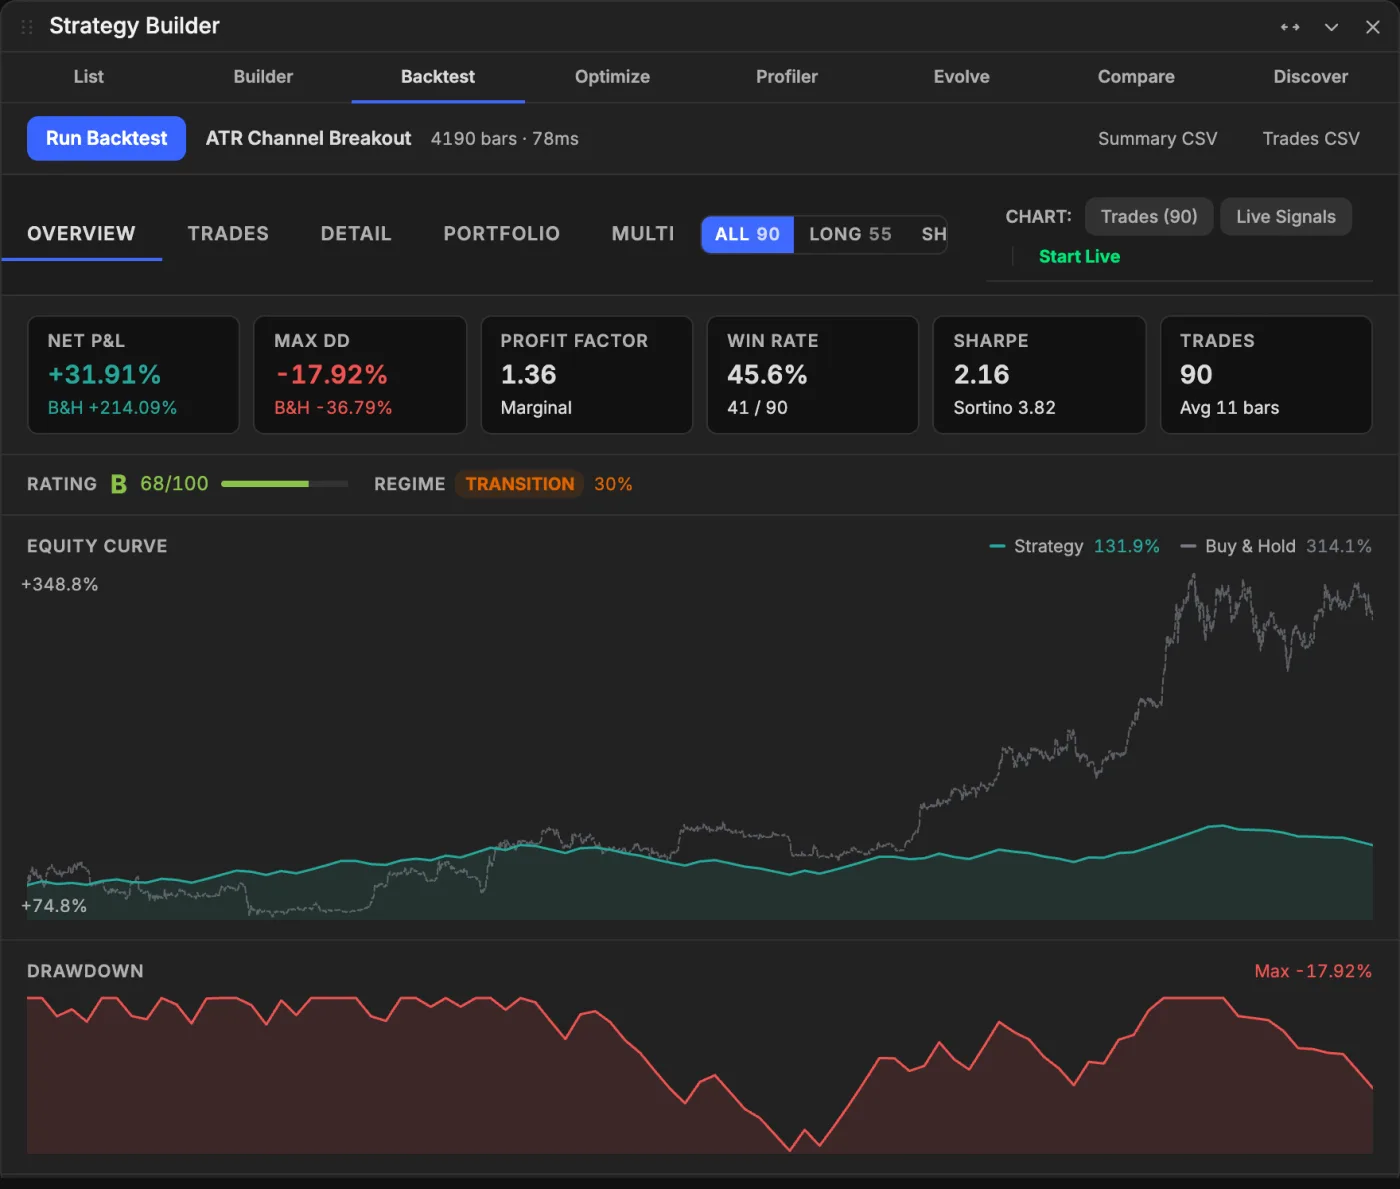
+31.9% in two years.
After costs.
BTCUSDT on the 4-hour chart, July 2022 to June 2024. 90 trades, profit factor 1.36, deepest drawdown 17.9%.
Holding the coin made 214% over the same bars. The report draws both curves on one chart, so that is the first thing you see.
- Fills
- At the close of the signal bar
- Costs
- 0.1% commission and 0.05% slippage, each side
- Size
- 2% of the balance at risk, stop 2.5 ATR away
- Start
- $10,000
Then it met bars
it hadn't seen.
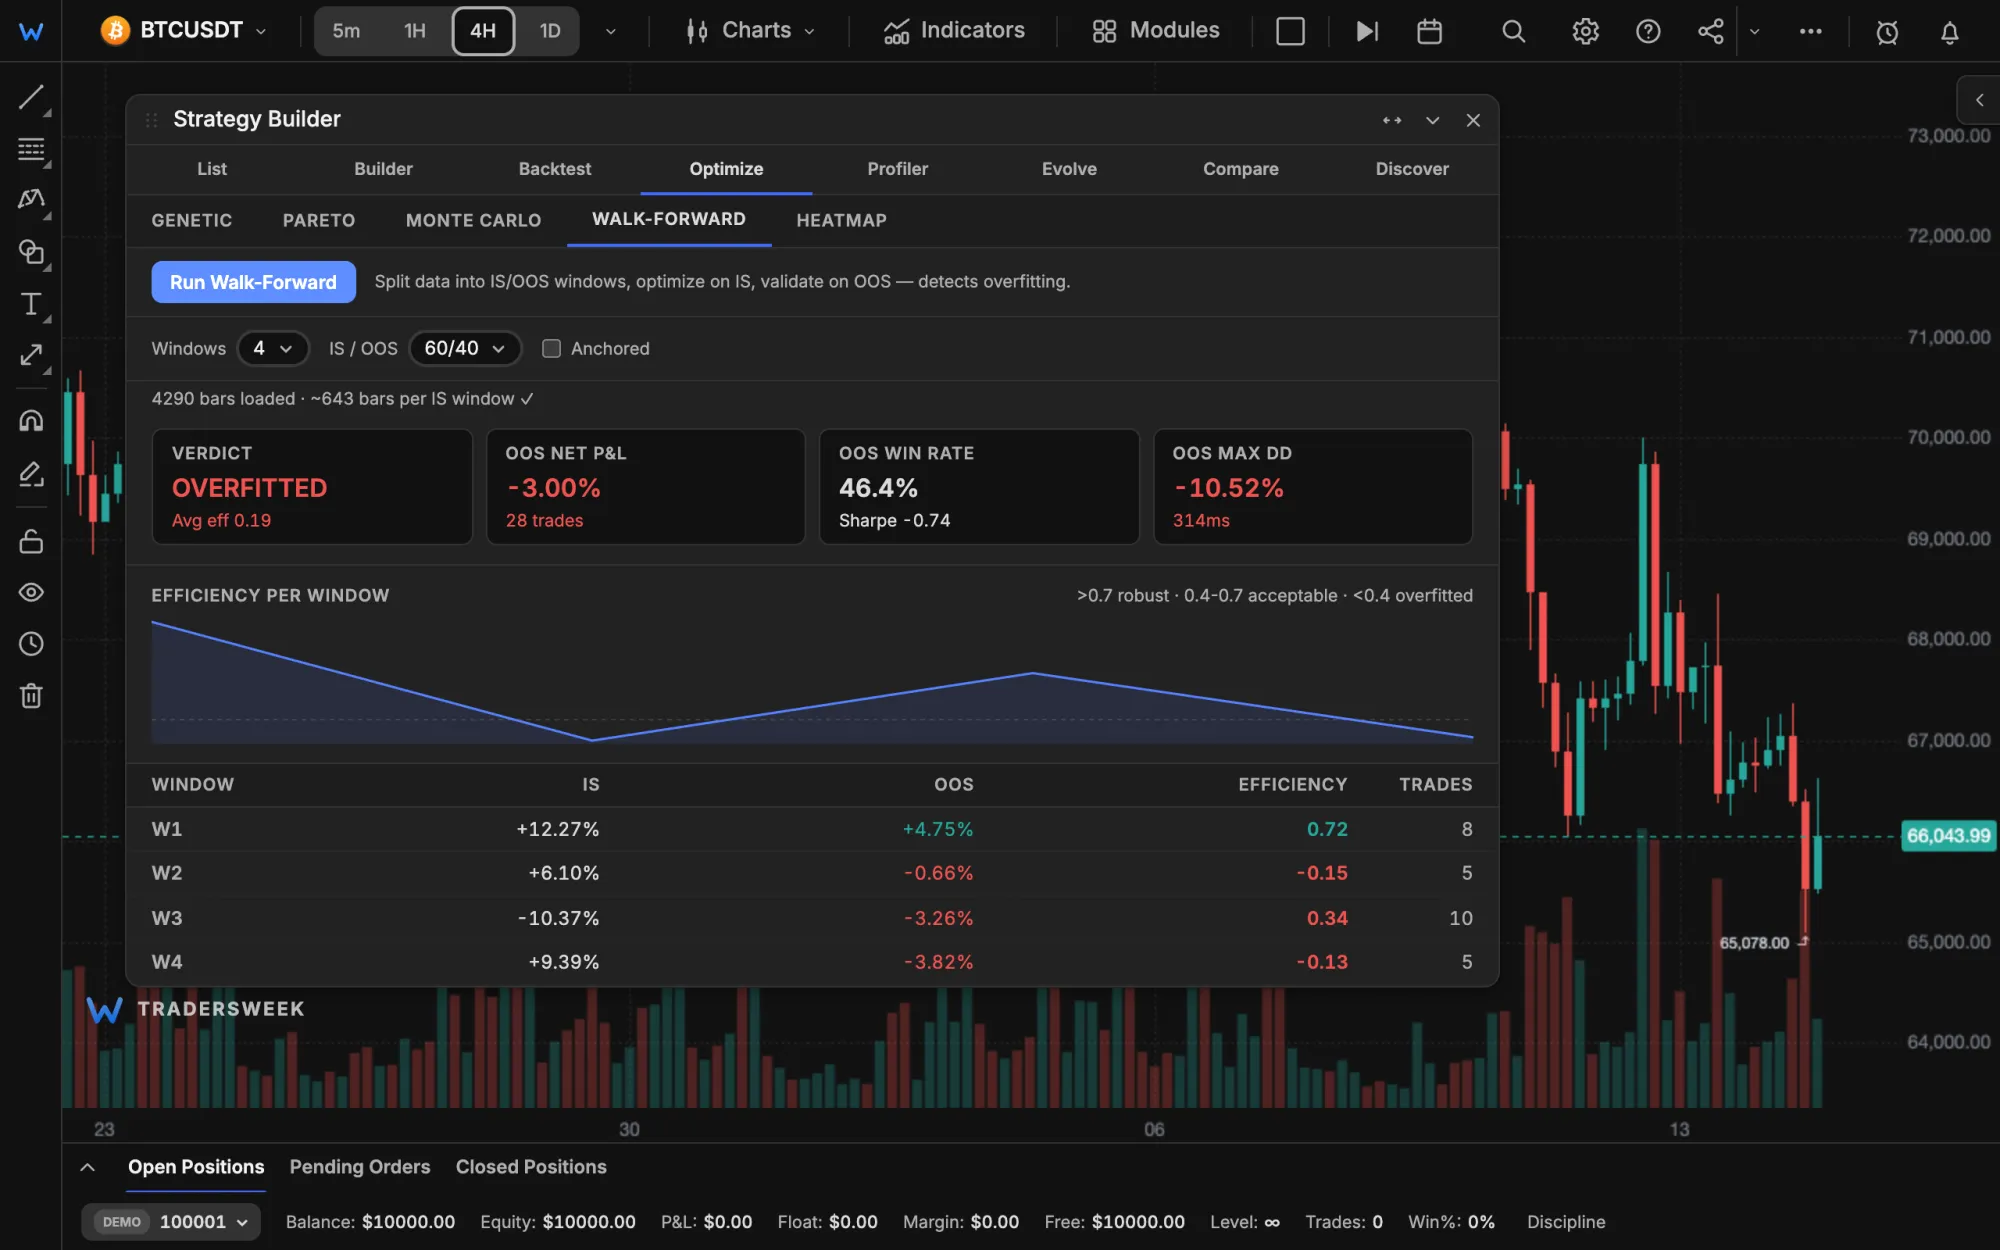
Walk-forward cuts the history into four windows. In each, a genetic optimizer re-tunes the stop, the targets and the ATR period on the first 60%, then trades the next 40% untouched.
Tuned, three windows of four made money. Untouched, one did. Together the unseen bars lost 3.00%, and the verdict is Overfitted. Efficiency is the untouched Sharpe over the tuned one, and the verdict takes its median across windows with at least 5 trades on each side: from 0.7 it says Robust, from 0.4 Acceptable.
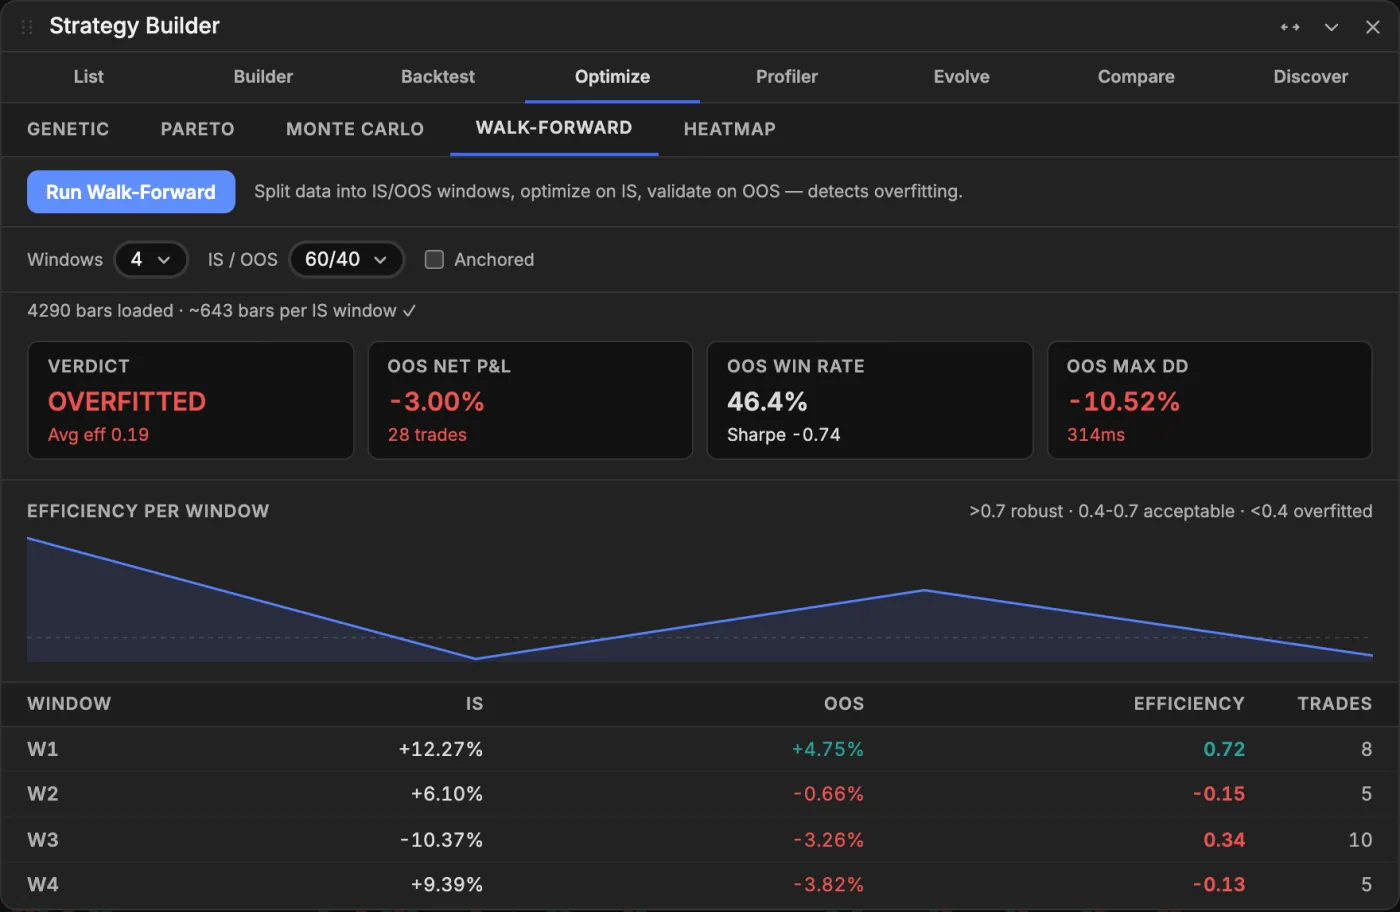 Walk-forward, recorded in the terminal
Same 90 trades.
A thousand orders.
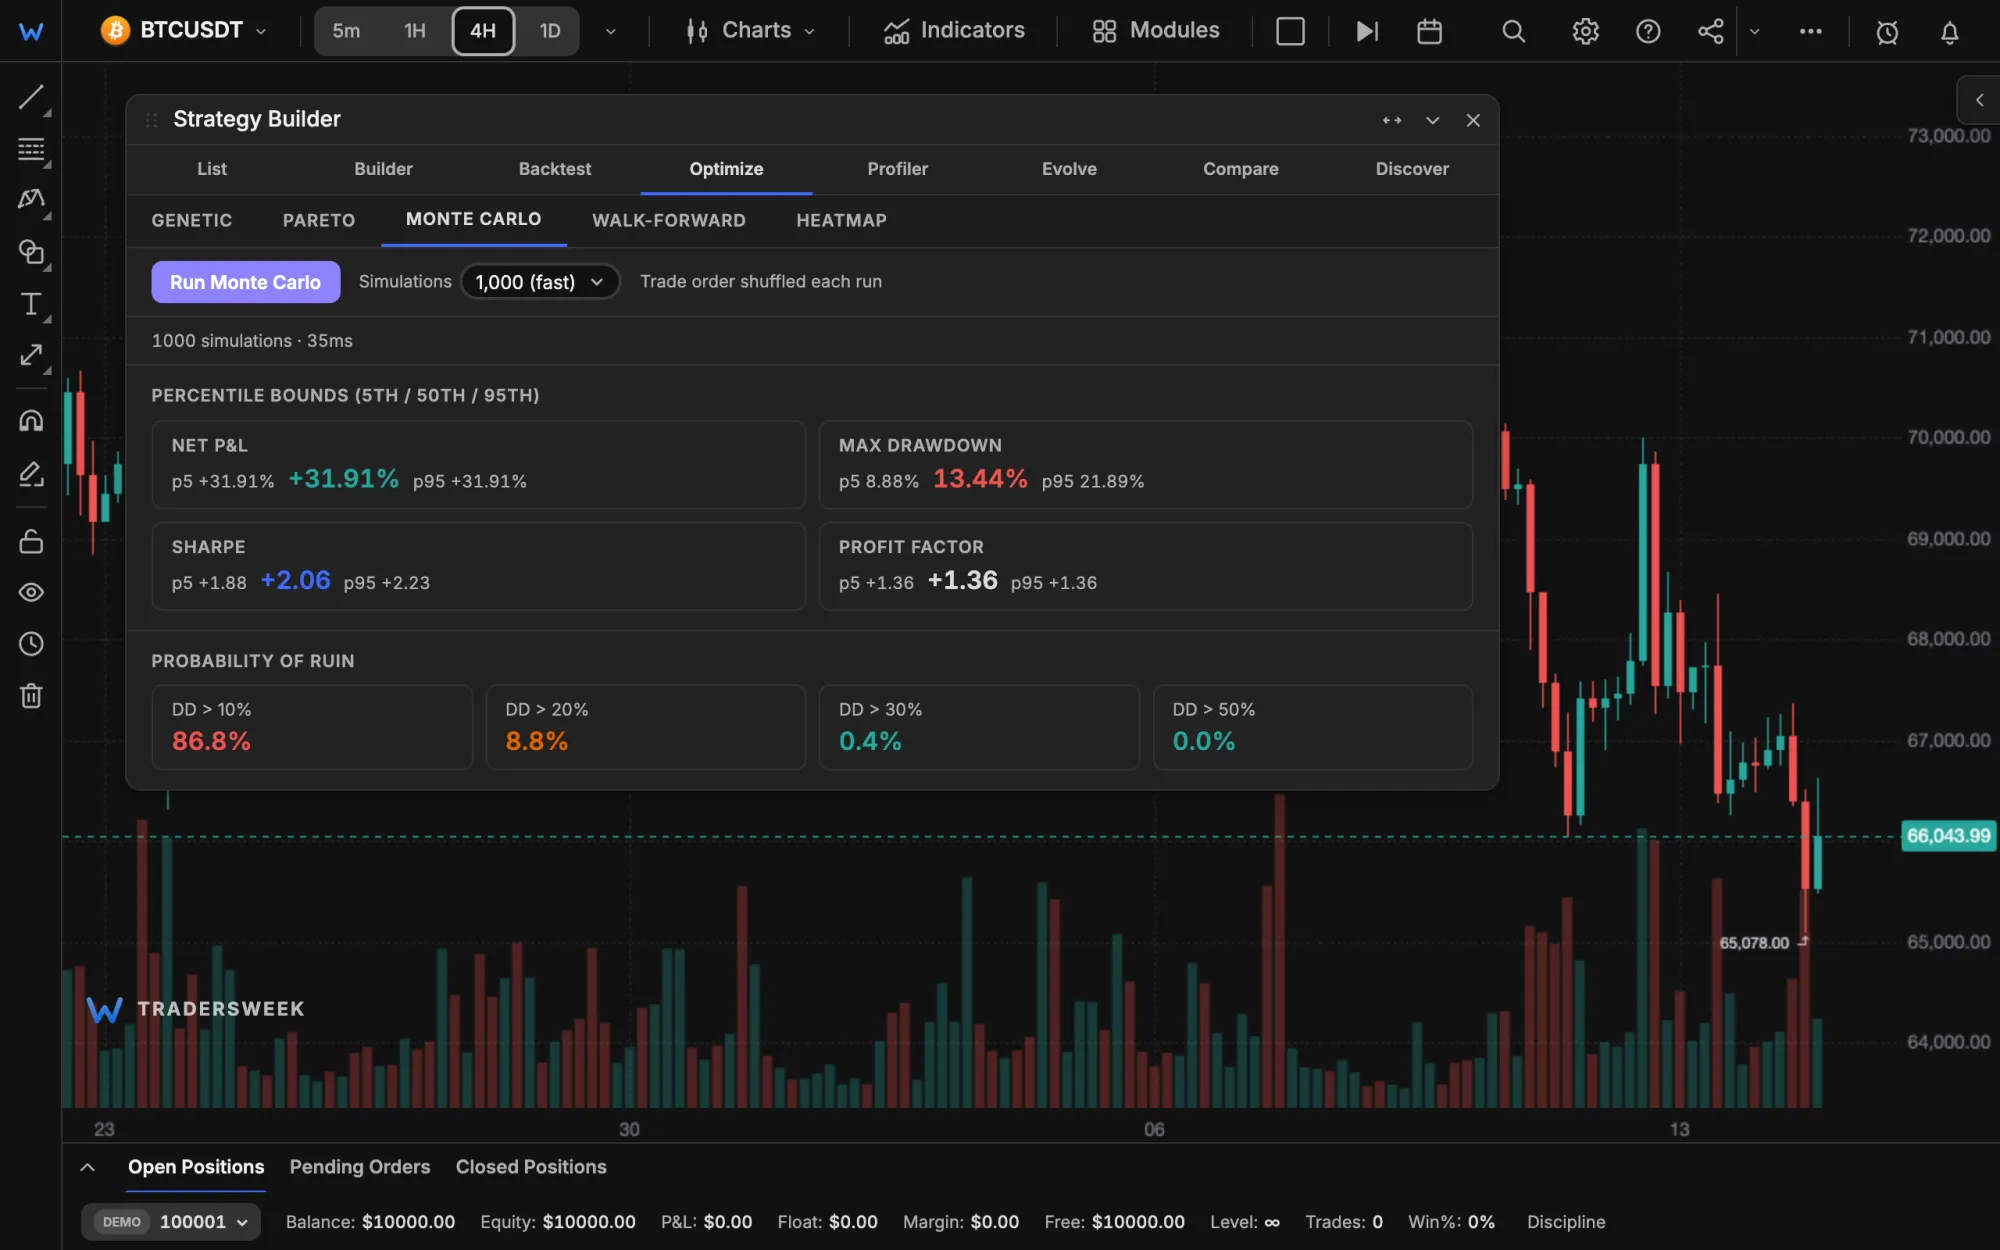
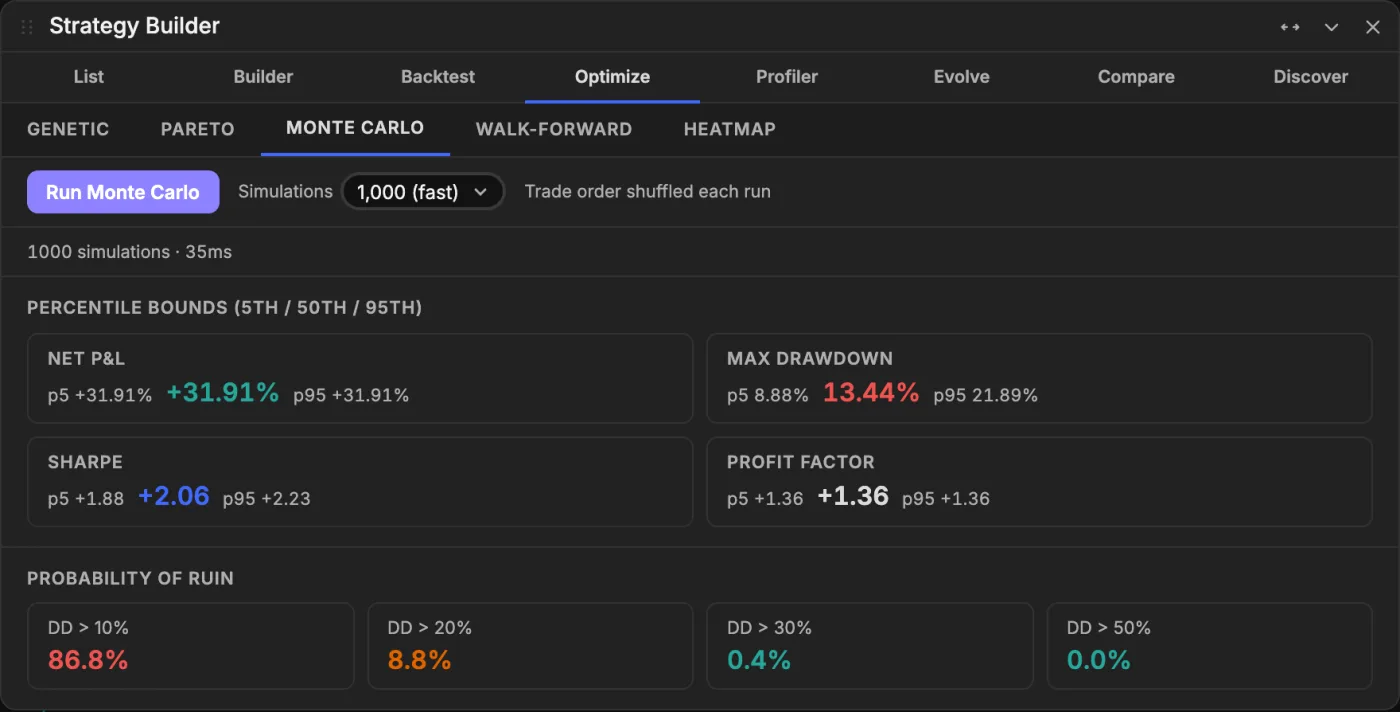
The 17.9% drawdown happened because the losses came in that order. Monte Carlo shuffles the same trades 1,000 times: the middle run draws down 13.4%, and one run in twenty goes past 21.9%.
The result stays at +31.9% in every run, only the path changes. Also 5,000 or 10,000 runs.
Overfitted
is a result.
The backtest and walk-forward took under a second, and none of it cost money. From here the idea can change, go on paper, leave for TradingView, or be dropped.
Tune it
The genetic optimizer searches stops, targets and indicator periods. The Pareto tab weighs two goals out of 12 against each other, Sharpe against drawdown for one.Then run walk-forward again: tuning is how this idea got overfitted.
Watch it on paper
Start Live marks signals on the chart as bars close. Paper Auto trades them on the paper account with a stop and target, sized by your risk per trade, and never on an exchange. It stays on the market you turned it on for, in the background, while the terminal tab is open.
Take it to TradingView
Export Pine writes the rules as Pine Script v5. Calendar and scanner conditions do not carry over, and the file marks where.
Let a bot trade it
Bots that place orders on an exchange are a separate tool, see Auto-trading.
What the test
assumes.
One run stops at 1,000 trades. With the default windows, walk-forward needs 2,100 bars on the chart from 15-minute to 4-hour, 2,050 on daily and weekly, 2,200 on 1 and 5 minutes: scroll left and older bars load.
| Setting | Default | Yours to change |
|---|---|---|
| Entry and exitMarket orders | Close of the signal bar | Limit or stop entry with an ATR offset |
| Stop and targetChecked on the bar's open, high and low | Stop 1.5 ATR, target 2 ATR. Both hit in one bar counts as the stop, unless the bar opens past the target | Second target, trailing stop, breakeven |
| CostsSet by the market you test | Each side: crypto 0.1% commission and 0.05% slippage, forex 0.002% and 0.005%, metals and energies 0.005% and 0.01%, stocks and indices 0.01% and 0.02% | Both |
| Size | 2% of the balance at risk per trade. The position is capped at 10× the balance on crypto, 30× on forex, 20× on metals and energies, 5× on stocks and indices, so a tight stop risks less | The percent, not the cap |
| HistoryCrypto from Binance, forex and metals through a MetaTrader bridge | The bars loaded on the chart | Scroll left for more |
Strategy questions
- Do I need to code?
- No. Conditions are picked from lists and grouped with ALL and ANY. On Premium you can also describe the idea in a sentence.
- Does a good backtest mean an edge?
- Not by itself. The idea on this page made +31.9% on history and lost on the bars walk-forward held back. Run both before trusting a number.
- Where does it run?
- In your browser. The optimizer and Monte Carlo work in the background, so the chart stays usable.
- Can I export to TradingView?
- Yes, as Pine Script v5. Rules on calendar events and scanner signals stay behind, and the file says which.
- Which plan do I need?
- Pro, $30 a month, with a sign-in. Describing a strategy in a sentence is on Premium.