The composite operator leaves a pattern. This module finds it.
Accumulation, distribution, springs, upthrusts — detected and labelled automatically. Phase state machine tracks the full Wyckoff cycle from markup to markdown. Effort vs result analysis confirms what volume is telling you.
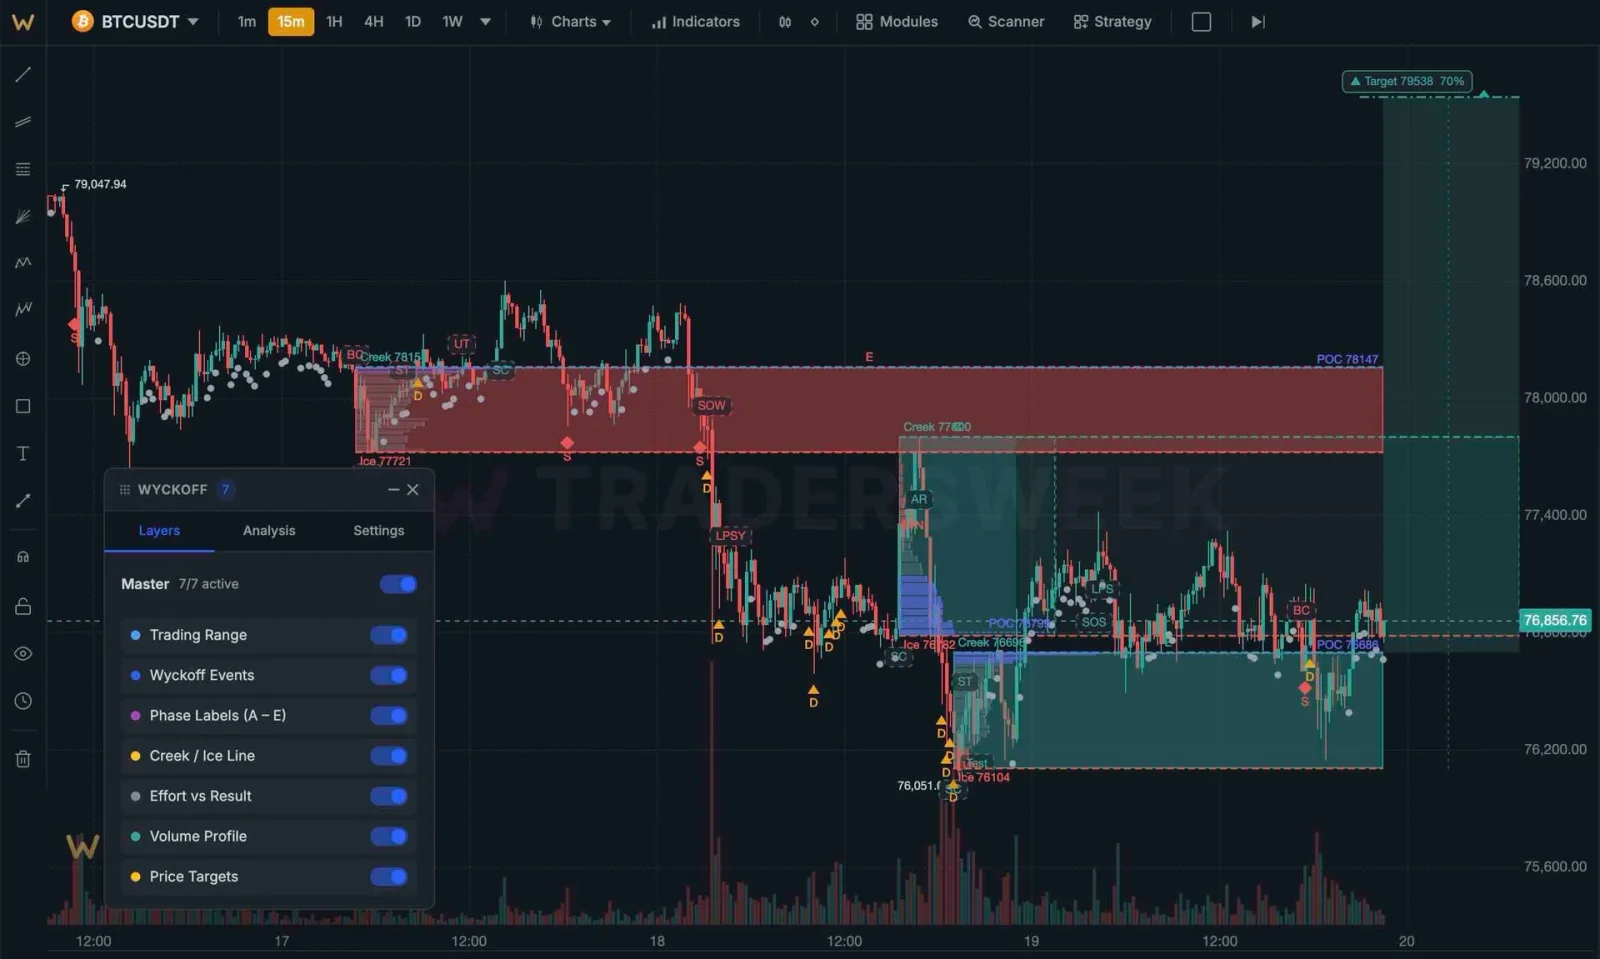
The full Wyckoff cycle, automated
From accumulation through markup to distribution and markdown — every phase labelled live.
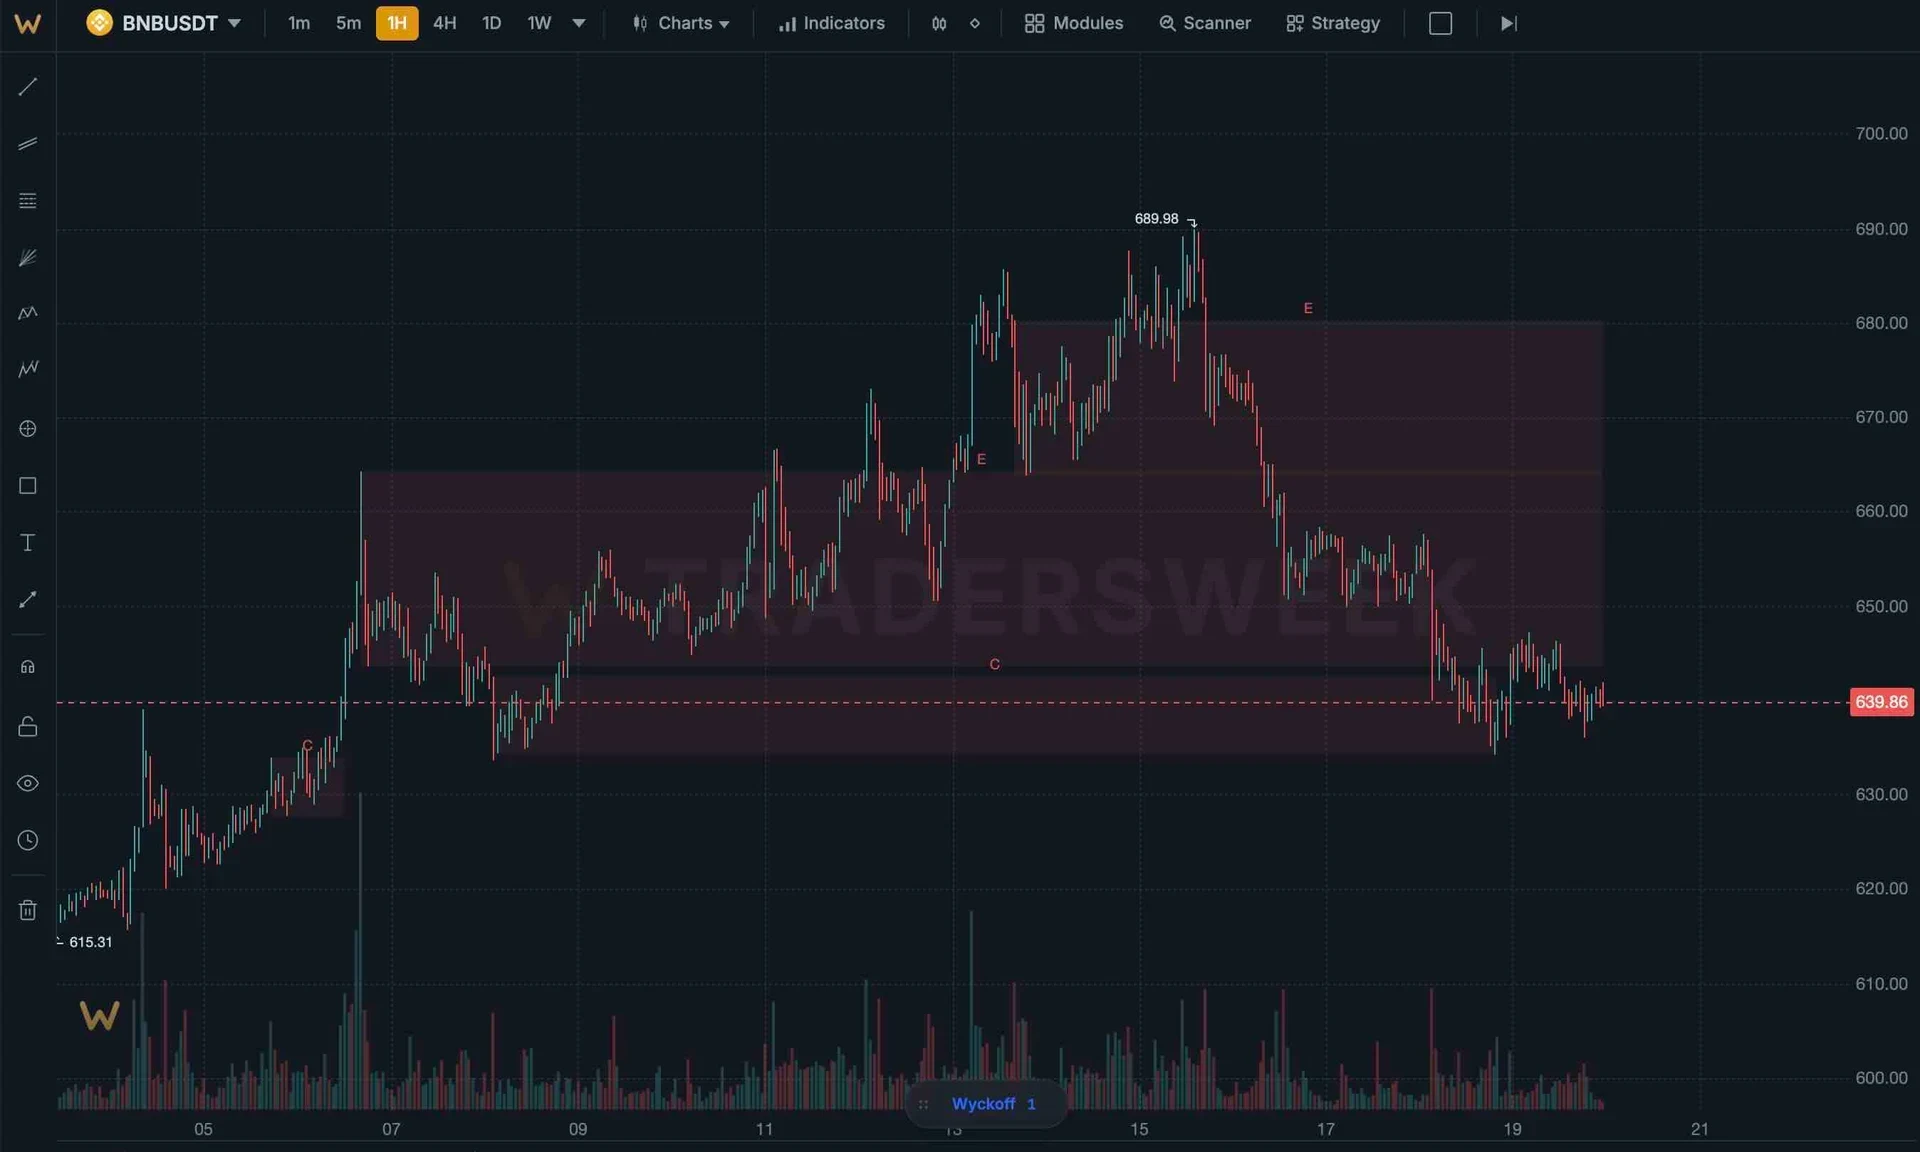
Phase state machine A–E
The engine tracks where the market is in the Wyckoff cycle. Preliminary support, selling climax, secondary test, spring, sign of strength — each event detected and labelled.
- 14 event detectors
- Accumulation and distribution schematics
- Phase transitions labelled live
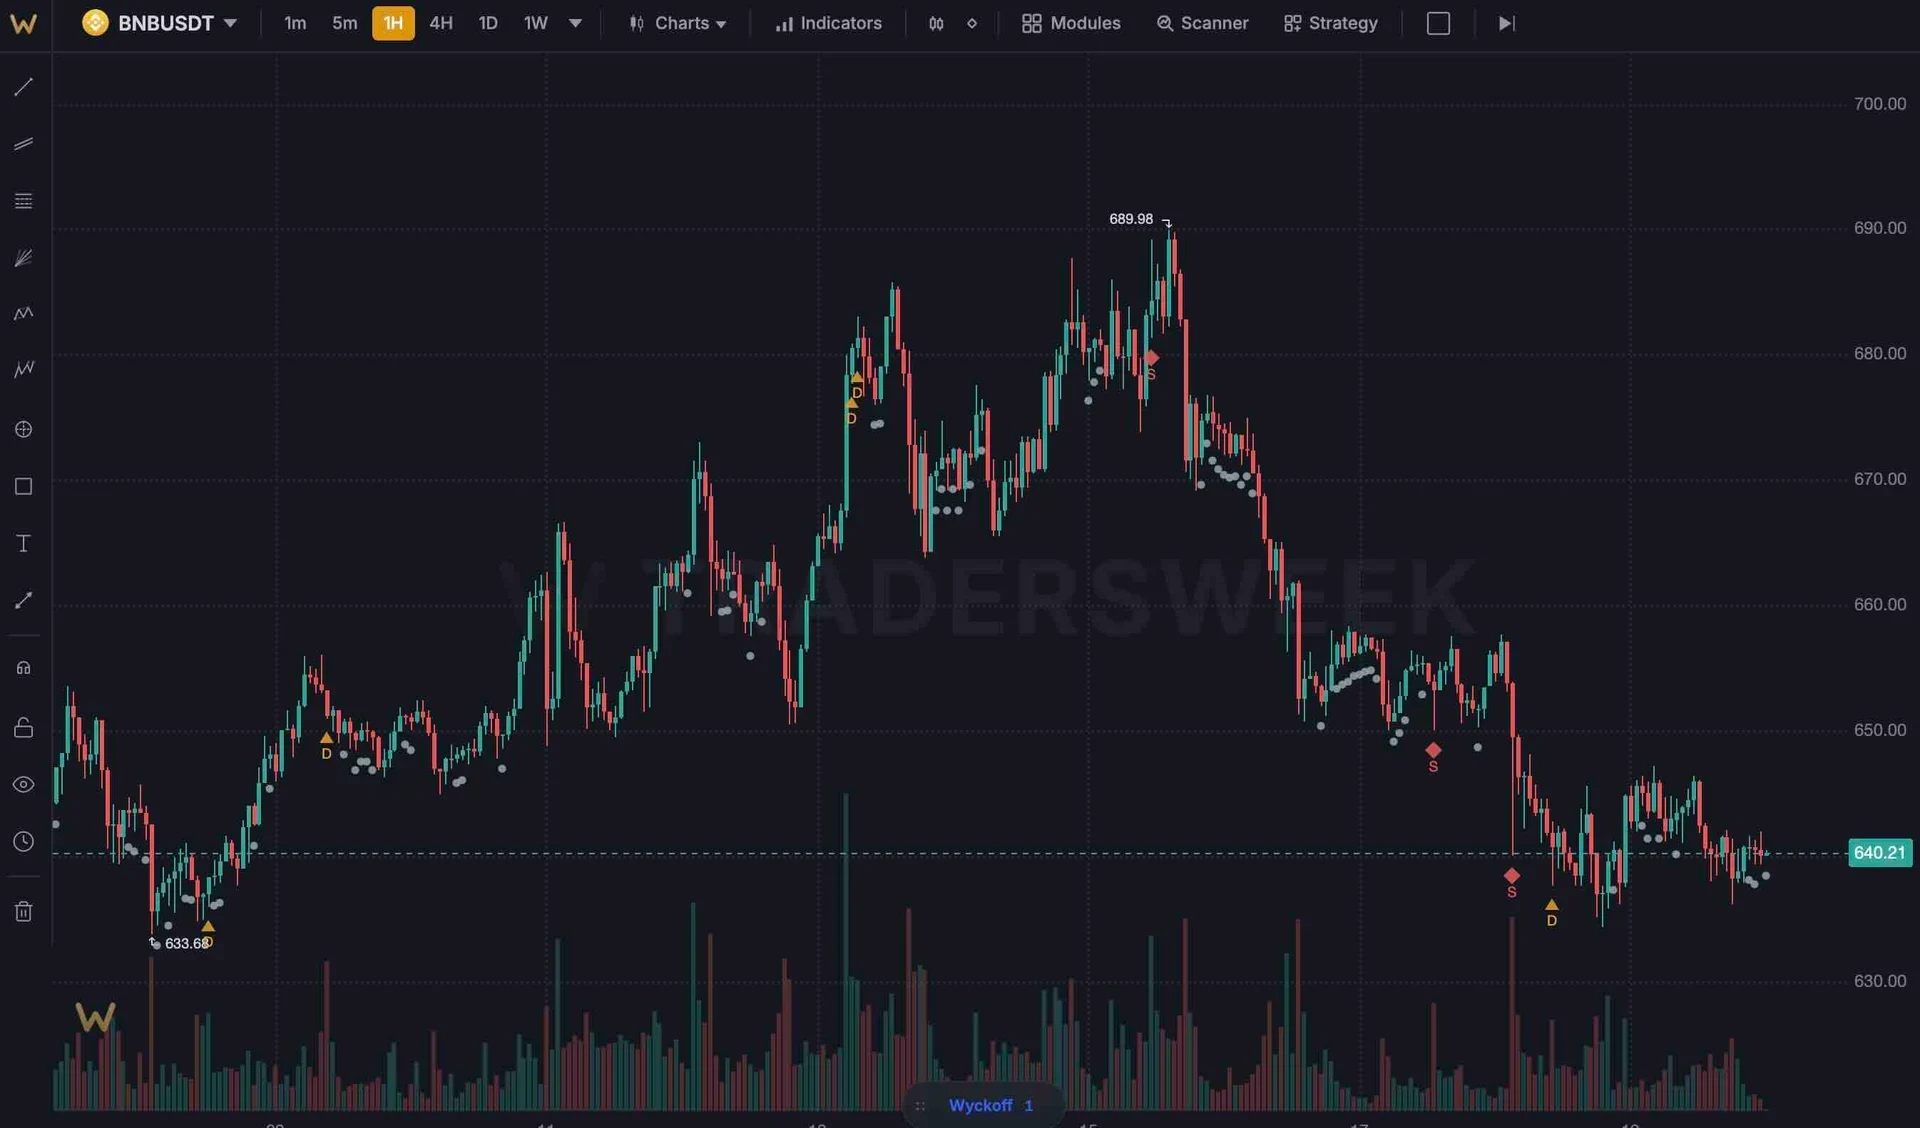
Effort vs result analysis
Compare volume (effort) against price movement (result). When effort exceeds result, the current move is weakening. Visual overlay on every bar.
- Volume-price divergence detection
- Weakening trend signals
- Confirmation of springs/upthrusts
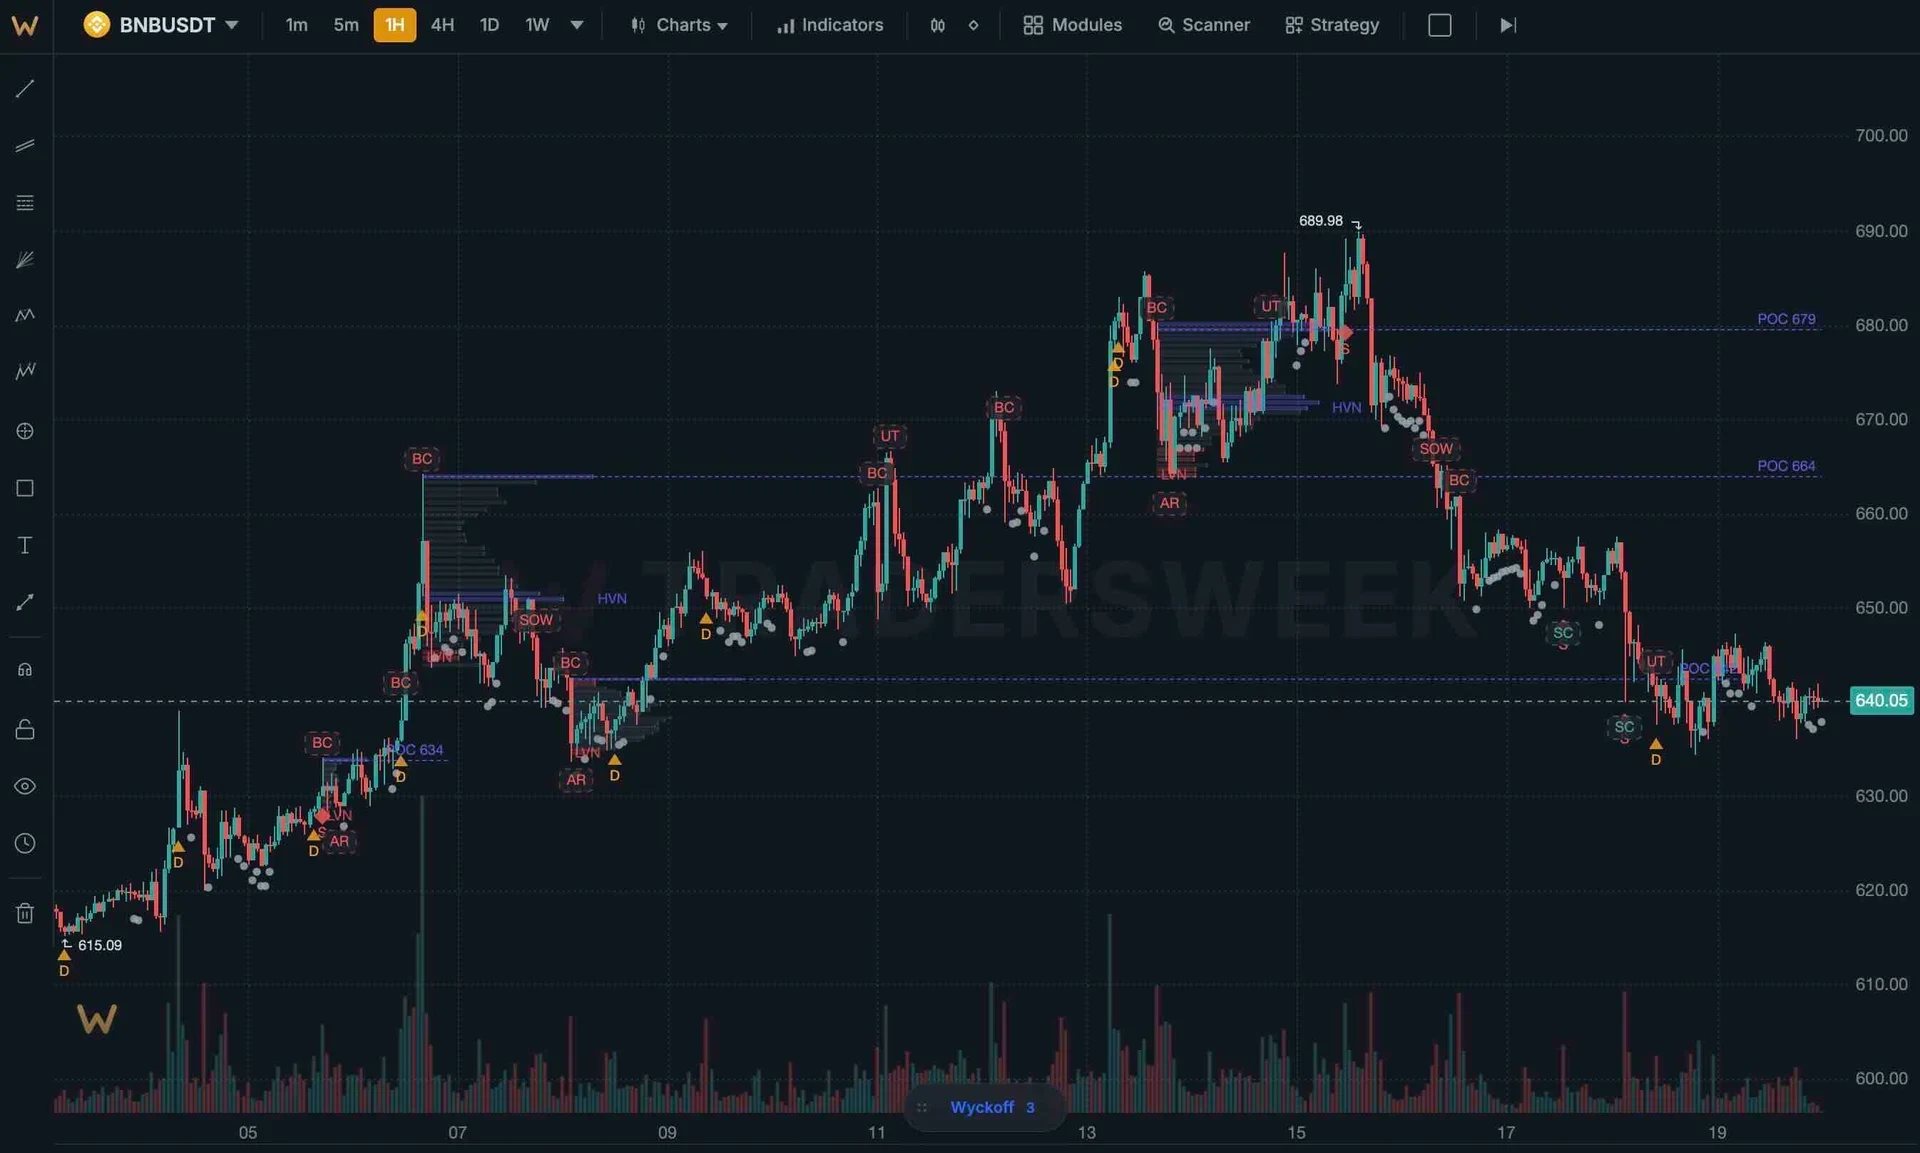
Point-and-figure counting
Horizontal count method for projecting price targets after accumulation/distribution. The classic Wyckoff technique, computed automatically.
- Automatic horizontal count
- Target projection zones
- Box size auto-calibration
from preliminary support to last point of supply — the full Wyckoff vocabulary
Wyckoff toolkit
Spring detection
Automatic identification of springs (false breakdowns in accumulation) with volume confirmation.
Upthrust detection
Distribution upthrusts flagged live. Volume divergence confirms the trap.
Multi-timeframe
Higher-TF Wyckoff structure overlaid on lower-TF chart. See where you are in the big picture.
Scanner rules
6 Wyckoff-specific scanner rules. Find instruments entering accumulation, showing springs, or beginning markup.
Schematic overlay
Reference schematic #1 and #2 overlaid transparently. Compare live price action to the textbook pattern.
Dashboard panel
Summary panel showing current phase, recent events, and probability of next transition.
Enable Wyckoff analysis
- 01
Activate the module
Modules panel → Wyckoff → Enable. Phase labels and event markers appear on the active chart.
- 02
Open the Wyckoff panel
Side panel shows the current phase, recent events, effort vs result status, and P&F count.
- 03
Watch for transitions
The engine alerts when a phase transition is detected. Spring in accumulation. Upthrust in distribution.
- 04
Project targets
P&F horizontal count gives a price target after accumulation or distribution completes. Use it as a position sizing input.
Is this based on the original Wyckoff method?
How does it detect phases?
Does P&F counting work on crypto?
Which tier do I need?
See the composite operator at work
Phase detection, spring/upthrust alerts, effort vs result, P&F targets — the full Wyckoff toolkit.