2018issue C1126-29
Why option risk curves fail to deliver theta
A platform risk curve can project a next-day markup from positive theta that does not appear the following session. Implied volatility, option-premium supply, and the volatility regime around a straddle can keep modeled decay from showing up in realized marks.
- A risk curve is a theoretical estimate of where a book sits now, not a reliable map of where it will sit after the next change in prices or volatility.
- Implied volatility, acting through vega, is a primary reason extrinsic premium often fails to erode as fast as a held model predicts.
- Supply and demand, including weekend mark-downs and skew that standard models do not explain, override the prices a risk curve assumes.
- High-theta structures such as calendars are also high positive-vega, so a fall in implied volatility can pull a once-positive curve below zero.
A snapshot is not the next print
Platform risk curves for income-style option books, including calendars, butterflies, short verticals, short strangles, and short straddles, can project a next-day P/L markup from positive theta that does not appear the following session.
A risk curve is a platform snapshot of theoretical value and next-session P/L under held assumptions. It is a theoretical estimate of where a book sits now, not a reliable map of where it will sit after the next change in prices or volatility. Theta is modeled time decay of option premium. It can fail to appear in realized P/L when other pricing factors move.
Implied volatility can overwhelm decay
Implied volatility is the market-cleared volatility priced into an option. It is the live input that can overwhelm a static decay path. Vega is the sensitivity of option value to implied volatility, and high-theta books are often also high-vega books. Through vega, implied volatility is a primary reason extrinsic premium often fails to erode as fast as a held model predicts.
High-theta structures such as calendars are also high positive-vega. If implied volatility falls after entry, the longer-dated long premium can lose more than the short premium decays, pulling a once-positive risk curve below zero.
In a what-if on a complex index book that was long vega, a downward volatility adjustment reduced the displayed mark. The same vega weight would lift the curve if volatility rose. The implied volatility of a held option need not track a broad index volatility gauge built from a specific strip of index option quotes.
Broker marks on a complex SPX options book
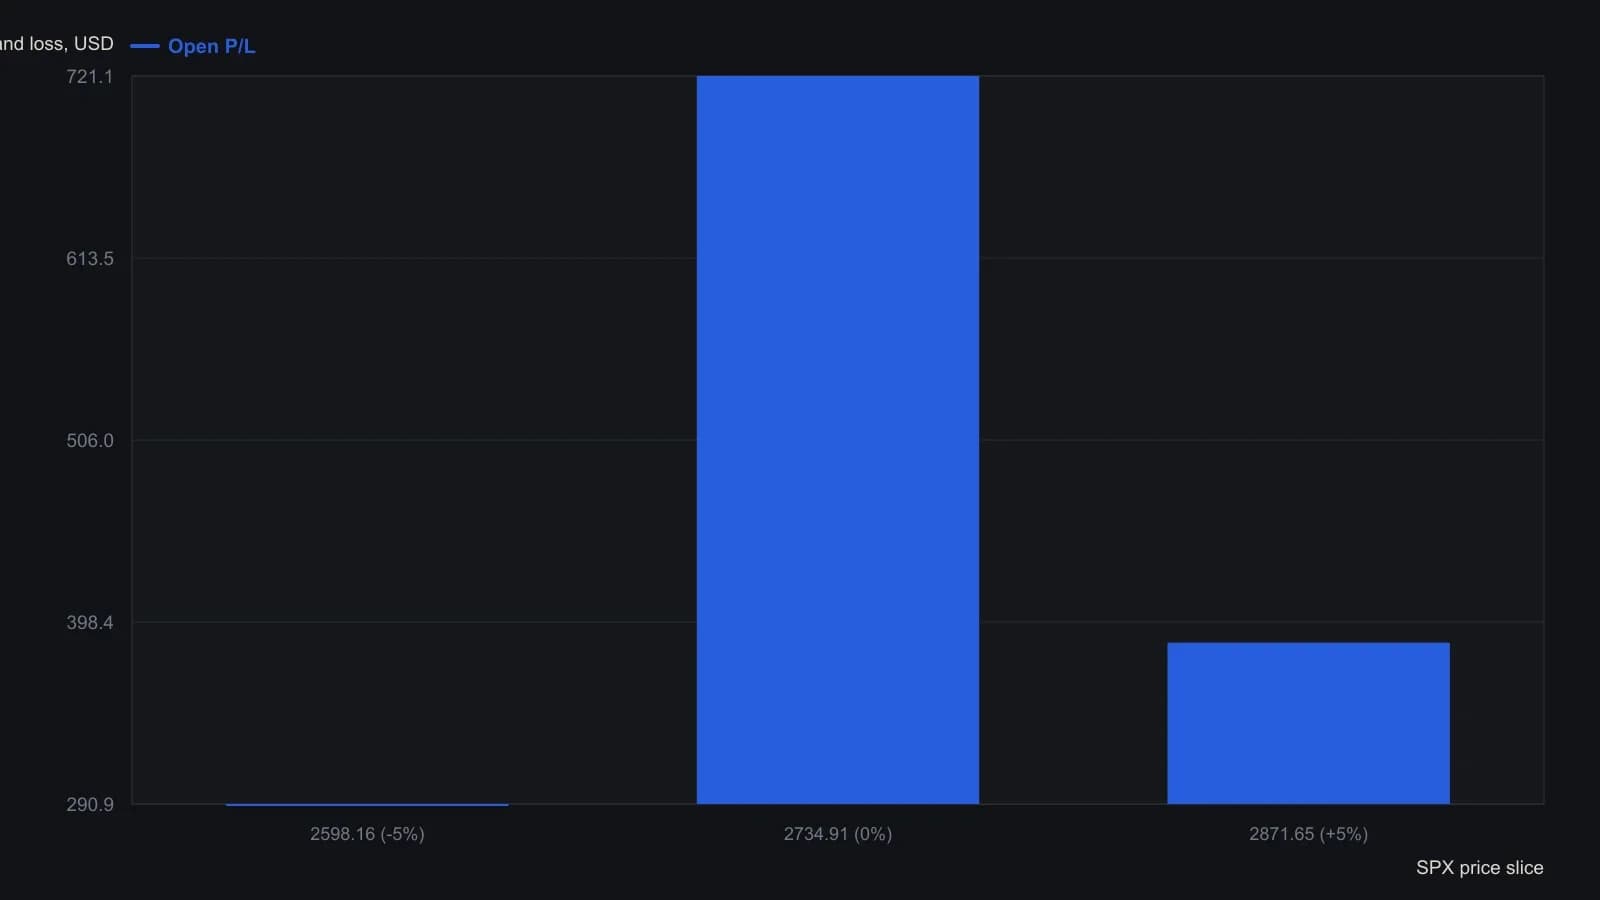
The same article states that cutting implied volatility two points drops the unchanged-price mark from $721.11 to $130.72. That shocked curve is not recovered here as a full series.
Premium marks follow supply and demand
Option-premium analysis reads extrinsic value, marks, and weekend repricing as supply-and-demand outcomes rather than as a guaranteed daily credit. Supply and demand, expressed as implied volatility and including skew that standard models do not explain, override the prices a risk curve assumes.
Paying above a spread's prevailing value changes the theta that can be realized. Weekend mark-downs that begin as early as Thursday can withhold the decay a seller expected over the weekend.
Straddles still sit in a volatility regime
An options straddle is a short or long combination of a call and put at the same strike. Its plotted theta still depends on the surrounding volatility regime.
A volatility eruption is a sharp rise in market-wide implied volatility. It can act like extending days to expiration, slowing the decay of time premium in a way that depends on how far strikes sit from the spot price. Modeled theta often grows larger near expiration, but the reliability of theta expectations is described as stronger early in a position's life than near expiry.
All readings on this track · 17 readings
- 1993Implied volatility zones for straddle overlays
- 2000Option premiums, implied volatility, and multi-leg payoffs
- 2003Volatility regime sleeves for spreads, straddles, and leverage
- 2003Implied-volatility regimes, straddles, and protective puts
- 2004Constructing an options straddle from historical and implied volatility
- 2004Credit-spread exits, implied volatility, and strike grids
- 2005Two gates for option-structure selection: regime, checklist, then strike geometry
- 2008Unused days in a short-hold straddle are still priced
- 2008Why a long-straddle misfits a readable sideways market
- 2011Sample variance as a context check for range and straddle ideas
- 2013Straddle construction across index dilution and volatility rank
- 2015Implied volatility, straddles, and premium-weighted put-call regime context
- 2016Isolating implied volatility with a delta-neutral option-income book
- 2017Stochastic divergence as a capped-payout options case
- 2017Implied versus realized volatility in a straddle case study
- 2018Why option risk curves fail to deliver theta
- 2019Long-dated call ratio backspread under compressed implied volatility