1993issue C061-18
Implied volatility zones for straddle overlays
Once listed premium is treated as efficient, implied volatility analysis and a six-zone deviation map decide whether the overlay should be a short straddle, a directional option, or a covered write.
- After listed puts restored conversion, a quarterly at-the-money writing overlay showed the writer-versus-buyer excess going to zero as listed premium became tightly arbitraged.
- Premium work then reduced to implied volatility analysis, and a 90-day deviation map placed index, sector, and single-name books on the same six implied-risk zones.
- Zone 1 framed the most aggressive long-stock and long-option stance, the opposite extreme favored insurance and writing, and the middle defaulted to a short options straddle.
- Constructions were chosen to match the zone, and a twenty-five-percent rule kept option buying to a modest number of slightly longer-dated at-the-money contracts with the rest in a low-risk sleeve.
From listed premium to a tight market
A non-managed, index-like overlay wrote 90-day at-the-money options on the first day of each quarter and bought them back on the last day. The exercise compared writer versus buyer outcomes and the overlay's effect on portfolio risk.
After listed puts arrived in 1980, that quarterly writing overlay showed the excess-return side of the writer-versus-buyer comparison going to zero as listed premium became tightly arbitraged. Option premium analysis then read listed premiums backward to recover the income, risk transfer, and writer-versus-buyer balance the market was embedding.
Conversion pulled the legs back into line
Listed puts restored conversion and related arbitrage. Conversion is a cash-and-carry package that combines stock, calls, and puts so mispriced legs are forced back into line. That restoration pulled mispriced calls, puts, and later futures-versus-stock packages back into line.
Implied volatility as the unknown
Among the usual pricing inputs, only volatility was treated as the unknown, so premium work reduced to implied volatility analysis: the volatility that, with known time, rates, dividends, and prices, justifies the observed option premium, expressed as an annualized daily standard deviation.
Implied volatility could persist in ranges and then reprice with the stock. One large-capitalization name sat near 20-22 for years, spiked as high as 48 after a late-1992 decline, then eased into the low 30s as the stock recovered.
Six implied-risk zones
A 90-day moving-average deviation was scaled by the options market's volatility estimate and mapped onto six implied-risk zones. The bins ran from more than two standard deviations below a 90-day average (zone 1) to more than two above (zone 6), so that index, sector, and single-name books sat on the same implied-risk field.
Over about 13 years of that map, zone 1 appeared only seven times, including October 1987 and October 1990. Those extremes were treated as the setting for the most aggressive long-stock and long-option stance. The opposite extreme favored insurance and writing.
Matching construction to the zone
In the middle of the price distribution the default neutral construction was an options straddle: a put-and-call package, short when the book was willing to buy lower and sell higher. Writing both a put and a call meant the book agreed to buy lower and sell higher.
Once a zone was identified, a spectrum of constructions was selected to match that zone rather than to hunt mispriced premium. Long calls sat at the low end, long puts at the high end, buy-writes or cash-secured puts through a wider middle band, and straddles at neutrality.
A twenty-five-percent rule kept option buying to a modest number of slightly longer-dated at-the-money contracts, with the remainder in a low-risk sleeve, instead of packing the book with the cheapest near-term out-of-the-money contracts. The same capital-allocation cap kept option buying to a modest multiple of the cash share count and parked the rest in that low-risk sleeve.
Implied-risk scores for 20 industry groups
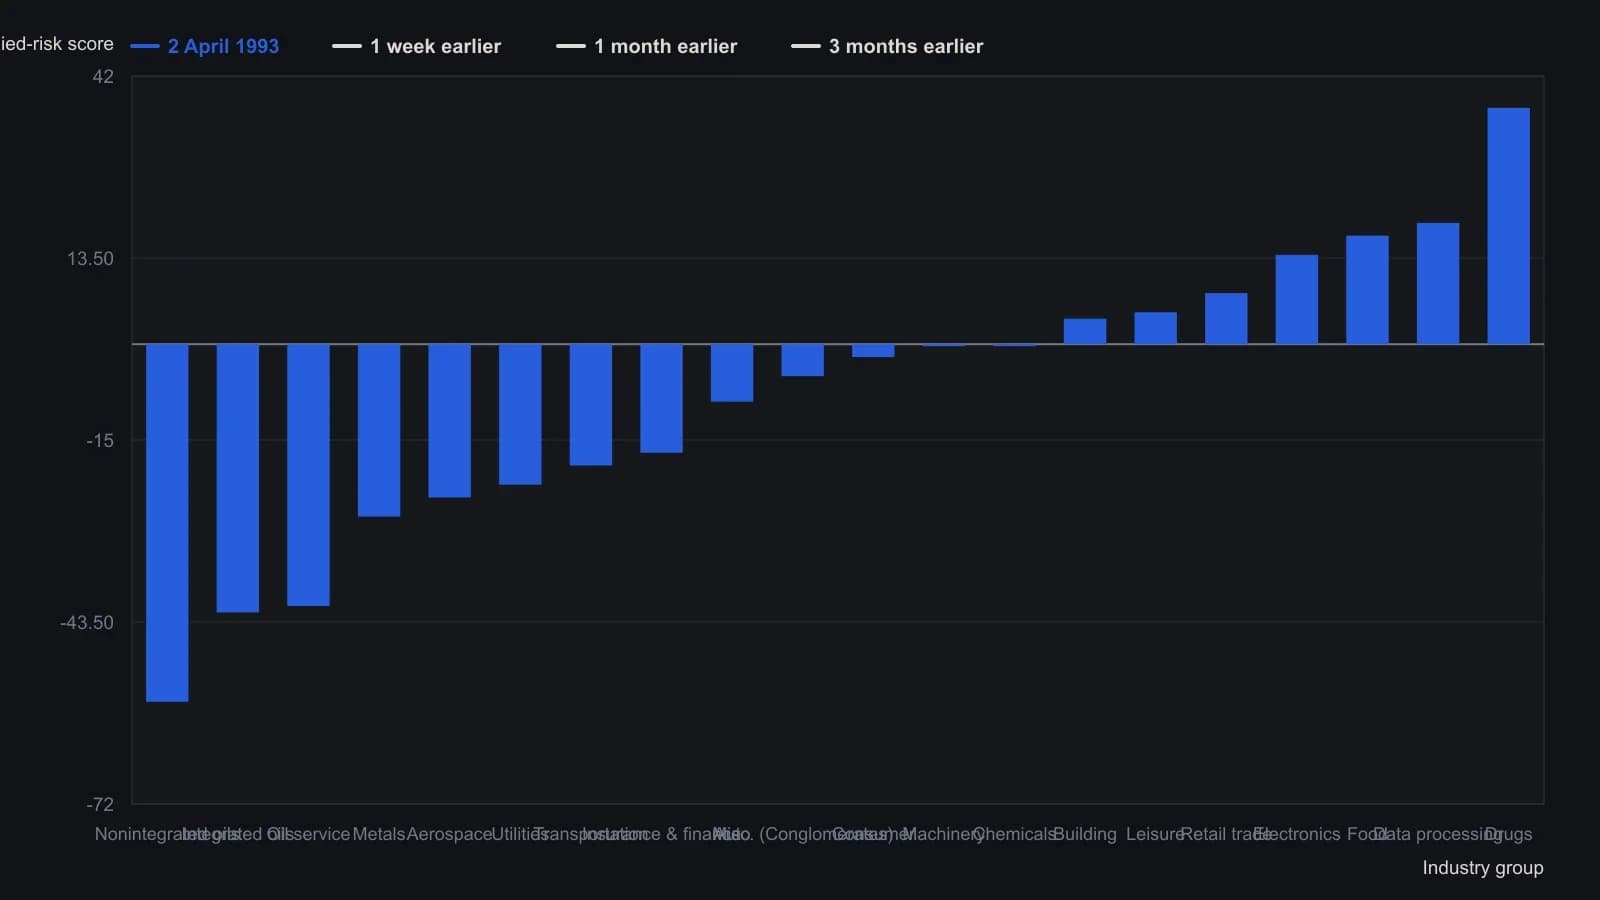
Score is the average 90-day implied-risk reading of optionable stocks in each of DYR's twenty groups. More negative readings sit above the 90-day trend (zones 5–6, overbought); more positive readings sit below it (zones 1–2, oversold). Zone cutoffs use a compressed 20-point scale because averaging damps the tails.
All readings on this track · 17 readings
- 1993Implied volatility zones for straddle overlays
- 2000Option premiums, implied volatility, and multi-leg payoffs
- 2003Volatility regime sleeves for spreads, straddles, and leverage
- 2003Implied-volatility regimes, straddles, and protective puts
- 2004Constructing an options straddle from historical and implied volatility
- 2004Credit-spread exits, implied volatility, and strike grids
- 2005Two gates for option-structure selection: regime, checklist, then strike geometry
- 2008Unused days in a short-hold straddle are still priced
- 2008Why a long-straddle misfits a readable sideways market
- 2011Sample variance as a context check for range and straddle ideas
- 2013Straddle construction across index dilution and volatility rank
- 2015Implied volatility, straddles, and premium-weighted put-call regime context
- 2016Isolating implied volatility with a delta-neutral option-income book
- 2017Stochastic divergence as a capped-payout options case
- 2017Implied versus realized volatility in a straddle case study
- 2018Why option risk curves fail to deliver theta
- 2019Long-dated call ratio backspread under compressed implied volatility