2000issue C031-4
Option premiums, implied volatility, and multi-leg payoffs
A historical option-premium analysis calibrated a pricing model with implied volatility so the theoretical value sat near the live quote, then walked a long call and a multi-leg book through price shocks and time decay.
- A standard options-pricing model takes current underlying price, strike, time to expiration, implied volatility, and the risk-free rate and returns a graphic premium-versus-price curve, the cost-profit curve used in option-premium analysis.
- Historical volatility of 50-52 produced a lower model premium than the live quote; implied volatility near 60 brought the theoretical price within four cents of that quote.
- The day-one long-call curve is not a one-to-one map of price, because option premium also moves with time decay; at an underlying of 176 the modeled gain was near 80% halfway to expiration and near 60% at expiration.
- A multi-leg strategy, including an options straddle that pairs a call with a put, is built by entering each option as a separate leg so the combined premium path can be inspected.
How a pricing model draws the premium
The archive workflow applied option-premium analysis with a standard options-pricing model. The model took current underlying price, strike, time to expiration, implied volatility, and the risk-free rate as inputs and returned a graphic premium-versus-price curve. That cost-profit curve placed option premium against underlying price so a reader could see, at a glance, whether risk or reward was capped.
On the four basic payoff diagrams, long calls and long puts capped loss at the option premium paid. Short calls and short puts capped profit at the option premium received and left loss open if the underlying moved against the position.
Calibrating the quote with implied volatility
Using a historical volatility of 50-52 on a volatile name produced a lower model premium than the live quote. An implied volatility near 60 brought the theoretical price within four cents of the quoted price. Implied volatility is the volatility input that makes a pricing model's theoretical value line up with the live option quote. Historical volatility is a backward-looking volatility reading from past underlying moves; in the worked case it understated the live premium relative to implied volatility.
Quarterly dividend inputs as high as two, or about 8% annualized, were treated as having a negligible effect on the modeled premium and were left at zero.
Price shocks and time decay on a long call
The day-one long-call curve is not a straight one-to-one map because the option premium is driven by both the underlying price and time decay. Time decay is the reduction in modeled option value as the calendar advances toward expiration while other inputs are held fixed.
In the long-call case, an immediate drop of the underlying to 140 produced a modeled loss near 810 per contract against a stated maximum risk of 1050, while a 20-point rise to 180 produced a modeled gain of 1350. An immediate doubling of that call's option premium required a 10% rise in the underlying, from 160 to 176.
With the underlying held at 176, advancing the calendar halfway to expiration left a modeled gain near 80%, and running the same price to expiration left a modeled gain near 60%.
Long December 160 call: modeled P&L versus stock price
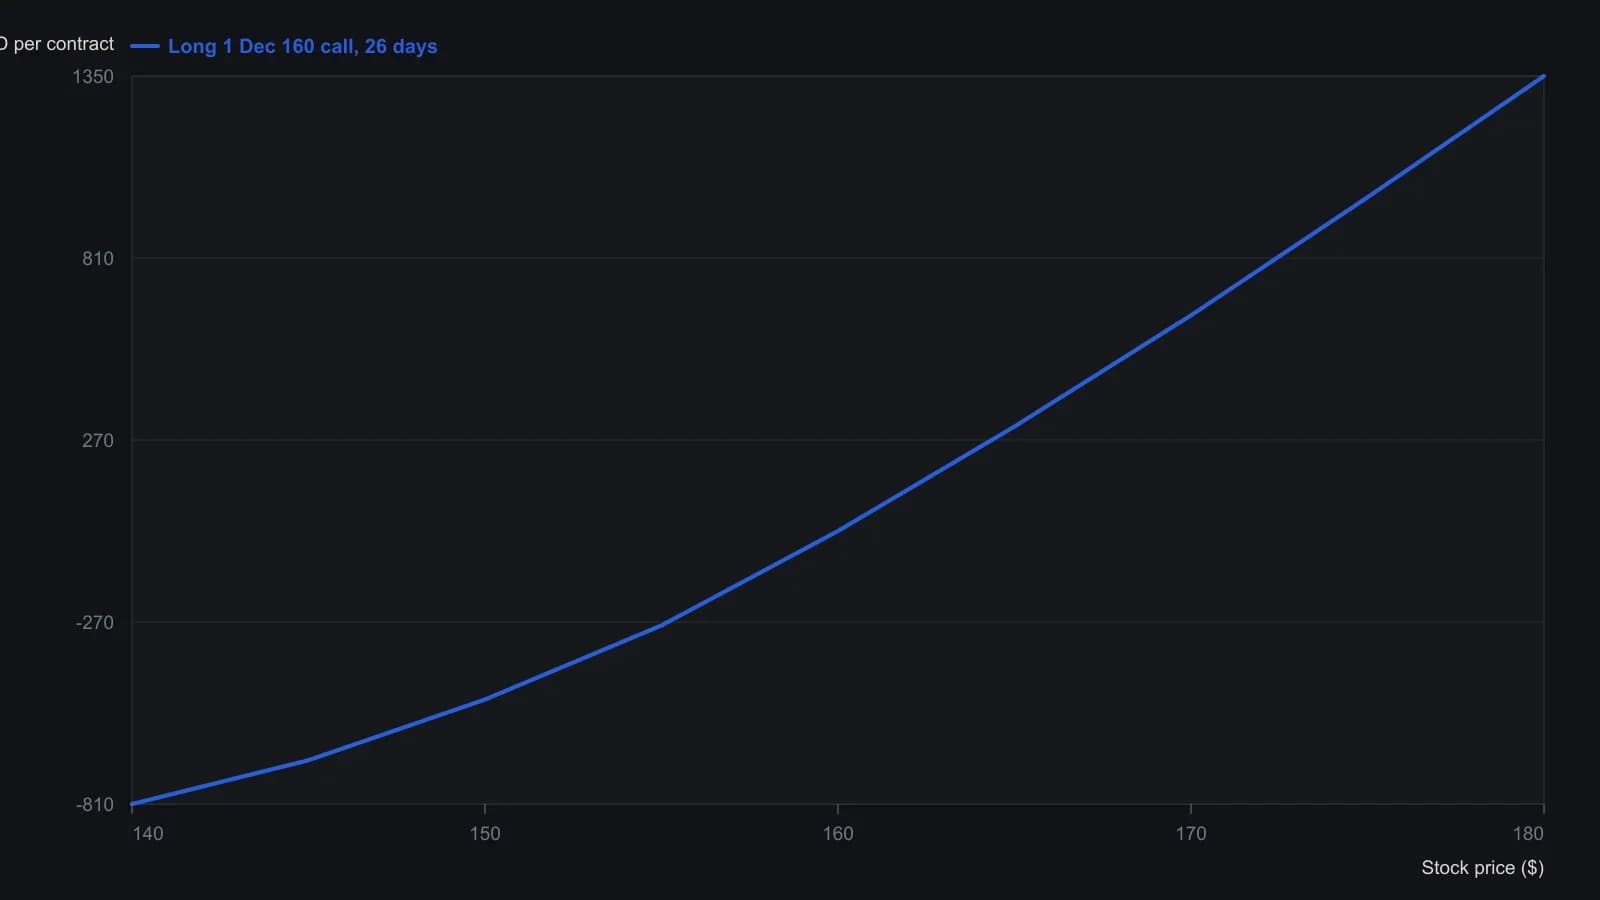
Implied volatility is fixed at 60 and the test date at 22 November 1999 (26 days to the December expiration). The calculator label is XYZ Corp.; the write-up names America Online as the live case. Intermediate P&L values between the stated $140, $160 and $180 anchors are approximate readings of the raster.
Inspecting a multi-leg book
A multi-leg strategy, including combinations that pair a call with a put, is built in the same model by entering each option as a separate leg so the combined premium path can be inspected. An options straddle is that two-leg book: a call and a put on the same underlying, read as a volatility sleeve.
Editorial: once those legs share one book, the combined path is how the idea is judged as portfolio context, not as a standalone payoff picture.
All readings on this track · 17 readings
- 1993Implied volatility zones for straddle overlays
- 2000Option premiums, implied volatility, and multi-leg payoffs
- 2003Volatility regime sleeves for spreads, straddles, and leverage
- 2003Implied-volatility regimes, straddles, and protective puts
- 2004Constructing an options straddle from historical and implied volatility
- 2004Credit-spread exits, implied volatility, and strike grids
- 2005Two gates for option-structure selection: regime, checklist, then strike geometry
- 2008Unused days in a short-hold straddle are still priced
- 2008Why a long-straddle misfits a readable sideways market
- 2011Sample variance as a context check for range and straddle ideas
- 2013Straddle construction across index dilution and volatility rank
- 2015Implied volatility, straddles, and premium-weighted put-call regime context
- 2016Isolating implied volatility with a delta-neutral option-income book
- 2017Stochastic divergence as a capped-payout options case
- 2017Implied versus realized volatility in a straddle case study
- 2018Why option risk curves fail to deliver theta
- 2019Long-dated call ratio backspread under compressed implied volatility