2019issue C0642-43
Long-dated call ratio backspread under compressed implied volatility
On the case date, 90-day implied volatility on a silver-tracking ETF sat at the lowest level recorded for that product’s options after more than 3.5 years of basing. Editorial: that cheap-premium setting is a regime input, not a timing signal for direction or expiration week, and the archive’s long-dated call ratio backspread sits inside a weeks-to-months plan driven by vega, theta, and strike asymmetry.
- Editorial: historically cheap implied volatility is used here as a regime marker, not as a cue to pick a direction or an expiration week.
- A call ratio backspread sells a lower-strike call and buys a greater number of higher-strike calls, typically leaving the book net long options and long vega.
- The worked book collected a 60-dollar credit and required 1,440 dollars of capital, equal to maximum risk only if it is held to expiration and the ETF closes at exactly 16.
- The illustrated book is short theta and long vega, so time spent range-bound enlarges the loss, while a later rise in implied volatility lifts the one-year risk curves.
A recorded low in implied volatility
On the case date, 90-day implied volatility on a silver-tracking ETF had fallen to the lowest level recorded for that product’s options, while the ETF price had been basing for more than 3.5 years. Implied volatility is the options market’s priced expectation of future movement, used here as a regime marker that can sit at historically low or expanded levels.
Time premium is the part of an option’s price above intrinsic value. Unusually low time premium is the case-study marker that the options were cheap.
The call ratio backspread
A call ratio backspread sells a lower-strike call and buys a greater quantity of higher-strike calls. The structure typically leaves the book net long options and long vega. The case used very long-dated contracts both to allow time for a large price move and to raise sensitivity to a later rise in implied volatility.
Vega is how much an option’s price changes if implied volatility moves by one percentage point. Longer-dated options have larger vega than shorter-dated options, so a one-percentage-point change in implied volatility moves their prices more.
A priced January 2021 book
The worked example bought 10 January 2021 calls struck at 16 for 1.23 and sold 5 January 2021 calls struck at 13 for 2.58. Option premium is the cash price of the options in the book. Credit received, capital required, and maximum risk are read from that premium, not from the underlying price alone.
That structure collected a 60-dollar credit, which is also the expiration value if the position is held to January 2021 expiry and the ETF finishes below 13. Capital required equaled the 1,440-dollar maximum risk, which occurs only if the position is held to expiration and the ETF closes at exactly 16.
SLV Jan 2021 call ratio backspread: P/L and Greeks by IV scenario
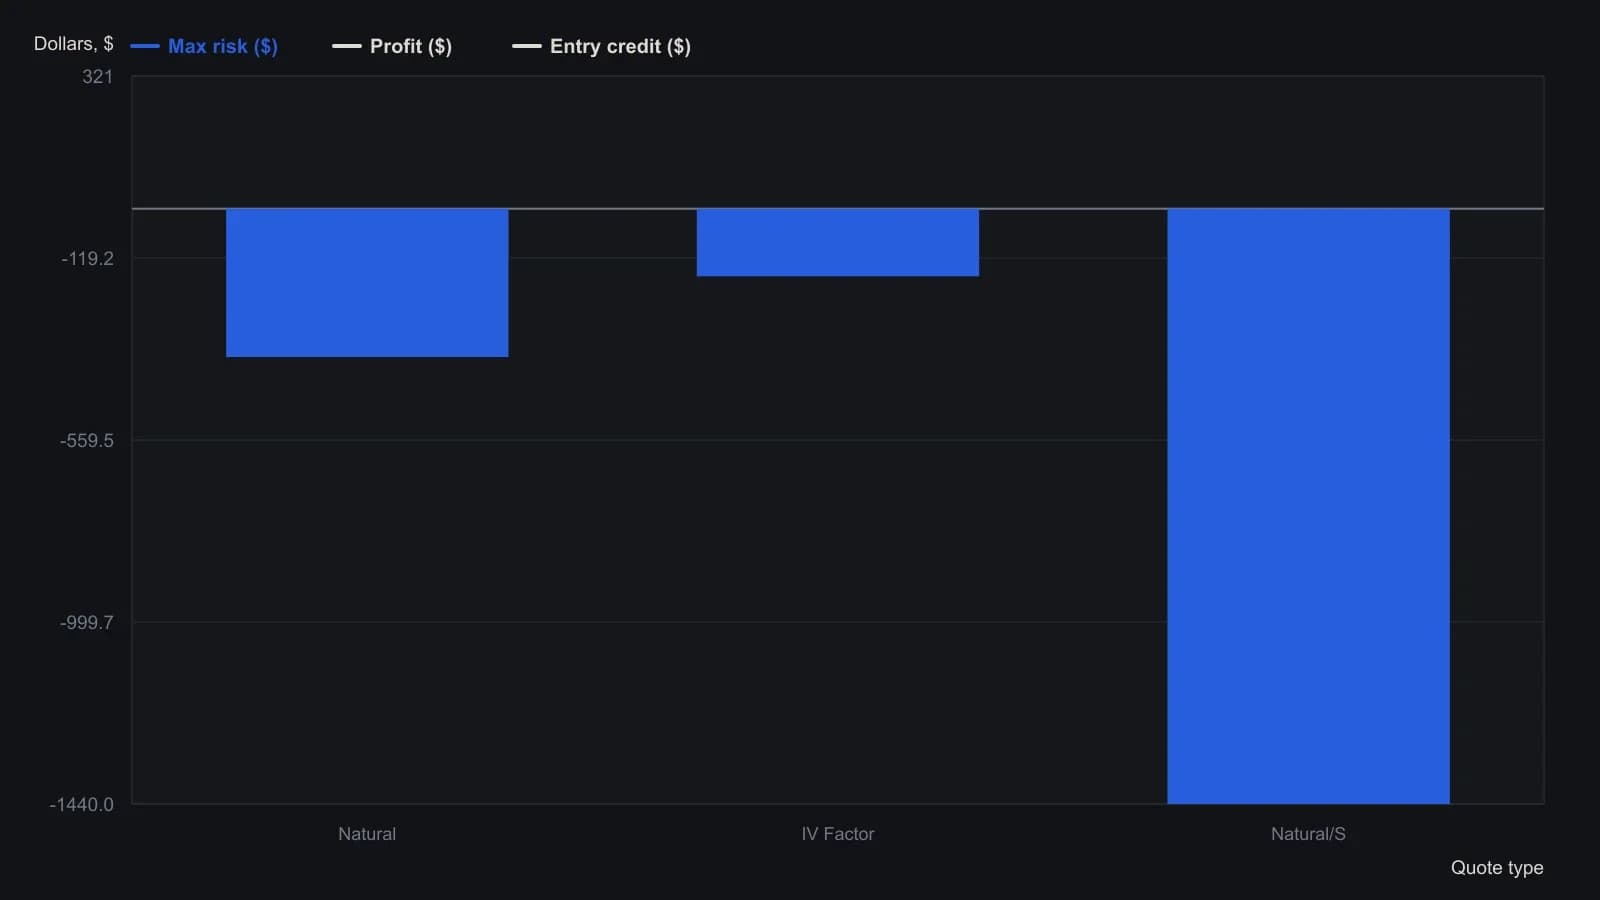
Table values are as of the 2 Apr 2019 log date; IV Factor is the platform’s 40% IV-up scenario. Position is long 10 SLV Jan 15 2021 16-calls at 1.23 and short 5 SLV Jan 15 2021 13-calls at 2.58.
Theta, vega, and the one-year risk curves
Theta is the loss of option premium as calendar time passes. A net-negative-theta book deteriorates if price stays in a range. That is why the illustrated book enlarges its loss while the ETF remains range-bound, even though a later rise in implied volatility can still reprice the long-dated contracts more than shorter-dated ones would.
A risk curve is a modeled payoff at a chosen horizon under an assumed implied-volatility path, used to compare an unchanged-volatility regime with an expanded-volatility regime. A hypothetical one-year hold with unchanged implied volatility reduced modeled maximum risk from 1,440 dollars to about 350 dollars. Because the book is net long options, a 40 percent rise in implied volatility from about 15 percent to about 21 percent lifts the one-year risk curves.
Editorial: those risk curves are a way to keep one cheap-premium structure inside a weeks-to-months, regime-aware plan. They are not a forecast of when the ETF leaves its range, and they are not a claim about live results.
All readings on this track · 17 readings
- 1993Implied volatility zones for straddle overlays
- 2000Option premiums, implied volatility, and multi-leg payoffs
- 2003Volatility regime sleeves for spreads, straddles, and leverage
- 2003Implied-volatility regimes, straddles, and protective puts
- 2004Constructing an options straddle from historical and implied volatility
- 2004Credit-spread exits, implied volatility, and strike grids
- 2005Two gates for option-structure selection: regime, checklist, then strike geometry
- 2008Unused days in a short-hold straddle are still priced
- 2008Why a long-straddle misfits a readable sideways market
- 2011Sample variance as a context check for range and straddle ideas
- 2013Straddle construction across index dilution and volatility rank
- 2015Implied volatility, straddles, and premium-weighted put-call regime context
- 2016Isolating implied volatility with a delta-neutral option-income book
- 2017Stochastic divergence as a capped-payout options case
- 2017Implied versus realized volatility in a straddle case study
- 2018Why option risk curves fail to deliver theta
- 2019Long-dated call ratio backspread under compressed implied volatility