1988issue C091-13
Evaluating stationarity, randomness, and dependence in an index series
A monthly index series can pass stationarity and randomness screens and still fail independence. Chi-square tests, transition matrices, and autocorrelation answer different questions, so a random-looking histogram is not a reason to skip memory checks before a forecast baseline is trusted.
- Stationarity is the first gate: later frequency tests assume generating rules that stay put across subperiods.
- Randomness means each change is an equally likely draw inside a fixed density, which is not a verdict on independence across time.
- Chi-square tests, transition matrices, and autocorrelation screens answer different questions, so a random-looking histogram is not a reason to skip independence checks.
- Tertile-coding and transition counts can show sequential memory that serial correlation and runs tests miss when raw prices jitter.
What each test is asking
A chi-square test is a goodness-of-fit comparison of observed frequencies with an explicit baseline. In this historical workflow it was used for stationarity, randomness, zero-point symmetry, and transition counts.
A transition matrix is a table of observed moves among categorized change states, judged against the product of the states' separate probabilities. An autocorrelation test is a serial-correlation screen for one linear form of dependence. It is treated here as incomplete when used alone on jittered raw prices.
Stationarity means the generating rules stay stable across subperiods, a precondition for tools that assume an unchanging process. Randomness means each realized change is equally likely inside a fixed probability density. Independence means one period's change does not influence a later period's change. Those three questions are not interchangeable.
Stationarity and randomness came first
On monthly index observations from 1945 through 1985, a stationarity chi-square of 14.84 was not statistically significant, so the generating process was treated as unchanged over that sample.
The same monthly series produced a randomness chi-square of 10.79 that was not significant, consistent with individual changes being equally likely inside the observed density. That result concerns draws inside a fixed density. It is not the same as independence across time.
Independence is a later gate
A single-frequency histogram of changes, with tails cut at plus or minus 5.0, yielded a chi-square of 181.59 against symmetry around zero, a highly significant rejection of independence. Repeating the symmetry test with tails cut at plus or minus 2.5 still produced a highly significant chi-square of 154.68.
A digram transition matrix on the categorized series had a chi-square of 30.60, and a trigram matrix had 94.73. Both were highly significant versus an independence baseline.
Tertile-coding without raw-price jitter
After coding each change into one of three histogram tertiles, waiting-time histograms triggered on a large rise, a large fall, or a mid-range change were visually uneven across months, including at a tenth subsequent match. Tertile-coding maps each change into one of three histogram bins so sequential state patterns can be counted without raw-price jitter dominating the test.
Calendar-window histograms that start from the first or last month of a trading year did not place the first subsequent tertile class equally across the twelve months.
Repeated-state triplets such as 1-1-1, 2-2-2, and 3-3-3 occurred more often than an independence product of state probabilities would imply, while mixed sequences such as 1-2-3 and 1-3-2 occurred less often.
Large S&P 500 gains cluster one month after a large gain
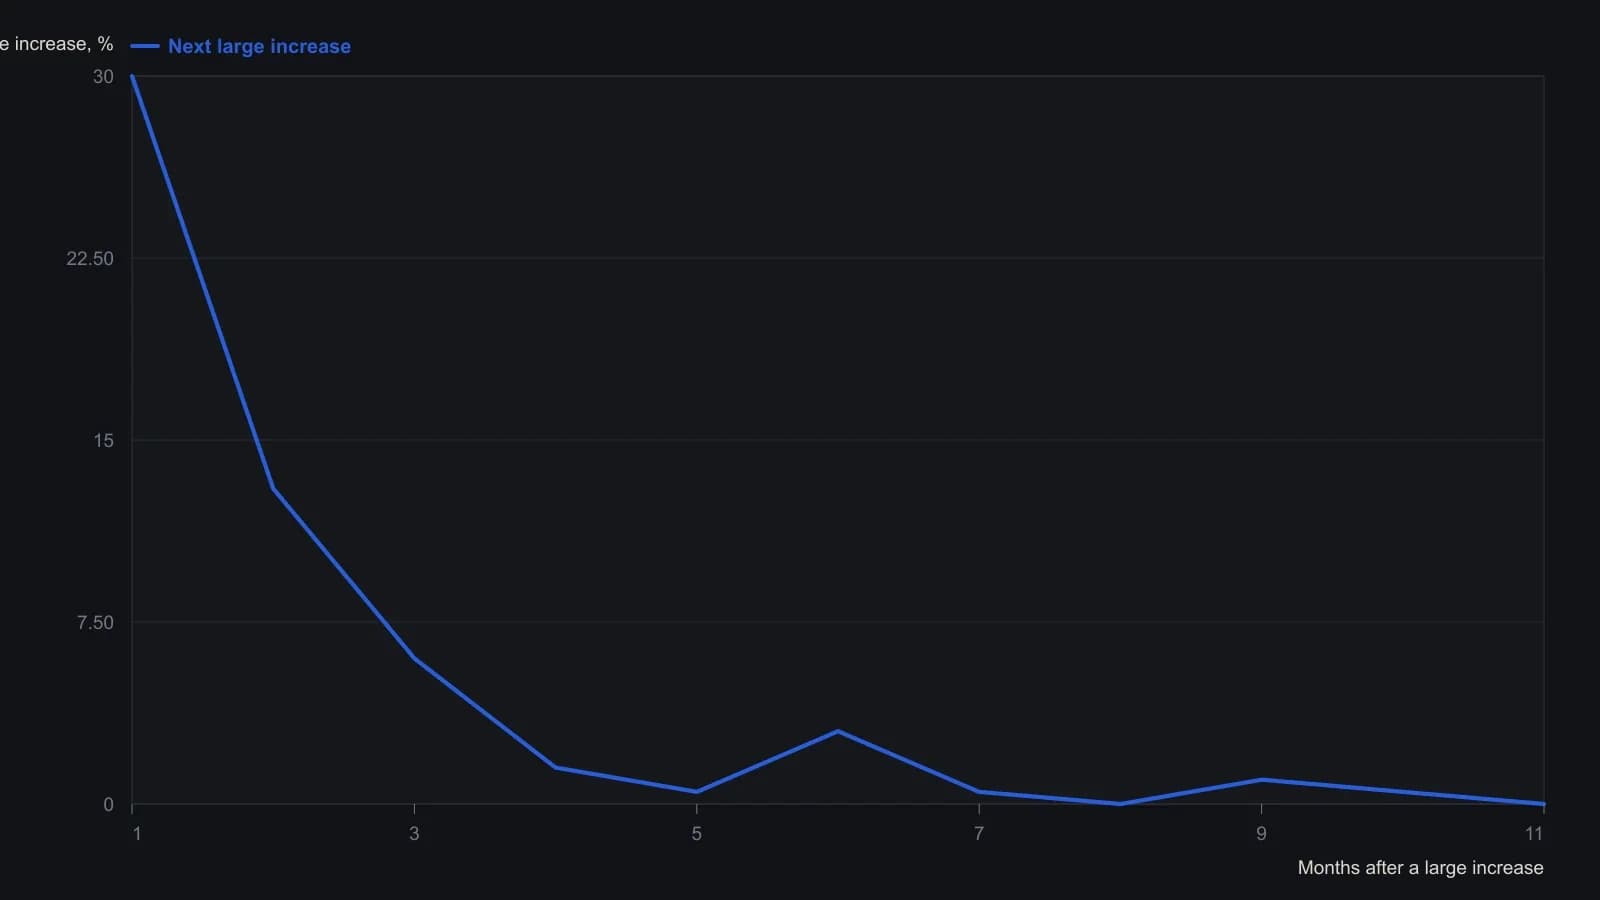
Sherry tertile-coded monthly price changes, triggered on a large gain (tertile 3), and binned the lag in months until the next tertile-3 gain. Sample is monthly S&P 500, 1945–1985. Heights are approximate readings from a coarse raster; empty months are plotted as zero, not interpolated.
Why serial screens are incomplete
Serial and autocorrelation procedures, and runs tests, are described as incomplete screens because they capture only some dependence forms and can be blurred by jitter in uncategorized prices. Editorial reading: those screens can sit beside a chi-square or transition-matrix check, but they do not replace the independence gate.
The same trigger-histogram and chi-square comparison applied to large money-supply increases versus later large index moves produced uneven monthly counts and statistically dissimilar fifth-lag histograms for large declines versus large advances.
All readings on this track · 6 readings
- 1985A serial-dependence window from signed price transitions
- 1986Chi-square tests on price transition matrices
- 1987Evaluating money-supply serial dependence before a forecast
- 1988Evaluating stationarity, randomness, and dependence in an index series
- 1993Constructing price-change Markov transition matrices
- 1995Collapse correlated inputs via a joint-state chi-square sequence