1989issue C111-5
Statistical windows for indicator time parameters
A trading-window is the longest lag at which every permutation-lag of an ordered series still exceeds a chosen confidence threshold for non-randomness or serial-dependency. The archive expanded chi-square-test, runs-test, and autocorrelation-test screens one lag at a time on listed-equity price, volume, and breadth observations. TradersWeek editorial: confine a time-parameterized tool to the last span that still rejects independence.
- A trading-window is the largest lag at which every permutation-lag still meets a pre-set chi-square-test threshold for non-randomness or serial-dependency.
- Chi-square-test, runs-test, and autocorrelation-test screens were lengthened one lag at a time, and every offset of that lag was retested, before a span was treated as still dependent.
- Price-linked series repeatedly produced non-random and dependent windows, while volume and issue-count series were largely random beyond short spans.
- TradersWeek editorial: confine a time-parameterized tool to the last span that still rejects independence in ordered price, volume, or breadth observations.
A trading-window is the largest lag at which every staggered permutation still meets a pre-set chi-square-test threshold for non-randomness or serial-dependency. Each permutation-lag is one of the staggered subsamples formed by stepping through an ordered series every n observations and repeating the same test on each offset.
The archive expanded chi-square-test, runs-test, and autocorrelation-test screens lag by lag on ordered price, volume, or breadth observations. TradersWeek editorial: confine a time-parameterized tool to the last span that still rejects independence, rather than choosing an indicator lookback by convention.
How the screens were expanded
The chi-square-test compared observed sign or transition counts with the counts expected under independence, and was used to judge whether a series still looked non-random at a stated confidence level. Sign-count non-randomness used cutoffs of 3.841 at 95% confidence and 6.635 at 99% confidence.
The same chi-square-test applied to four successive-change cells, the serial-dependency check, used 14.067 and 18.475 as the 95% and 99% cutoffs. Serial-dependency here means an excess of same-direction successive pairs relative to the four-cell counts expected if consecutive changes were independent.
The runs-test treated serial-dependency as more consecutive same-direction changes than a random series with the same number of signed moves would show.
Autocorrelation-test scans asked whether today's signed value still depended on earlier observations while the window was lengthened one lag at a time and every offset of that lag was retested.
Windows on the listed-equity series
Daily listed-equity observations ran from 2 January 1945 through 30 December 1988, except volume and the cumulative percentage-change index, which began 1 May 1964. Saturday sessions were dropped, and weekly series used calendar-week arithmetic averages.
On the tested industrial-average price series the short-horizon window was 19 to 25 days and the long-horizon window was 140 to 149 days.
Price-linked series repeatedly produced non-random and dependent windows, while volume and issue-count series were largely random. Advance, decline, and unchanged issue-count and volume series had no non-random or serially dependent window longer than one week. Only total issues and total volume showed short dependence on weekly averages.
Total issues and total volume were serially dependent for 10 days at the 99% level. At the 95% level those windows were 15 days and 10 days.
Weekly averages generally lengthened serial-dependency windows and shortened non-randomness windows, with at least one 92-week window at 99% confidence.
Lookback horizons that still reject independence
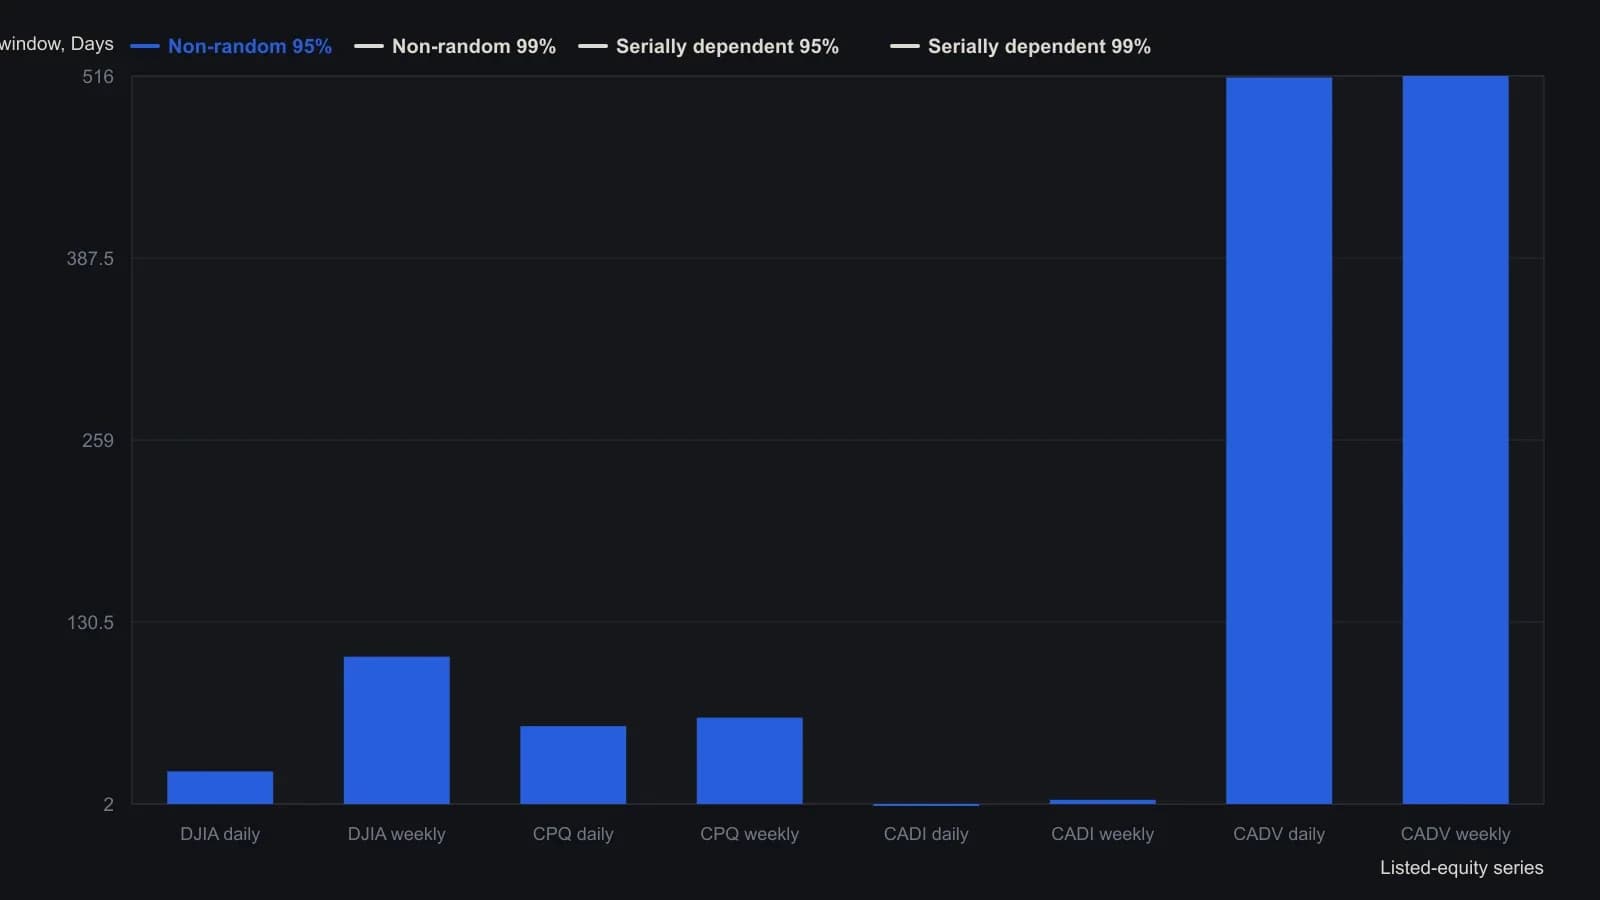
Chi-square cutoffs were 3.841 (95%) and 6.635 (99%) for non-randomness, and 14.067 (95%) and 18.475 (99%) for serial dependence. Weekly day counts are the source conversions at 4.8114 days per week. Volume and Quotron run 1964-05-01 to 1988-12-30; other series run 1945-01-02 to 1988-12-30. Saturdays were dropped. Advancing, declining and unchanged issue and volume counts produced no window longer than a week and are omitted, as in the source table.
All readings on this track · 15 readings
- 1986Constructing runs and persistence tests from labeled prices
- 1986Evaluating daily price and volume serial independence windows
- 1986Evaluating advance-decline plus-day runs against chance baselines
- 1986Weekly resamples as a diagnostic filter for statistical windows
- 1988Runs test as a critique of price-series memory
- 1989Evaluating weekday close direction with a counted baseline
- 1989Statistical windows for indicator time parameters
- 1992Channel-height ratios for equity trend evaluation
- 2001A runs test before volatility and expected-value sizing
- 2005Constructing runs-test z-scores for signed return persistence
- 2005Evaluating persistence with runs and autocorrelation
- 2005Weekday FX turning points and close run tests
- 2013Constructing a runs-test turn forecast
- 2017Star rating from slope and swing runs
- 2018Regime-dependent odds after directional price runs