2005issue C011-6
Evaluating persistence with runs and autocorrelation
Editorial stance: treat a switching-rate persistence screen as unproven until a runs test and a lag-one autocorrelation diagnostic null at the same rate. The historical evaluation used that joint crossing, near 63 switches a year, as the near-random region for later overlay-versus-hold charts.
- A runs-test Z score can show how far an ordered return series sits from a random run count, but the historical evaluation did not treat that single statistic as enough.
- In the reported samples the runs Z score and the lag-one Osc1 diagnostic declined together as annual switching rate rose and crossed zero at the same rate of 63.
- Editorial reading: a switching-rate persistence screen stays unproven until both diagnostics null at the same rate on that axis. Only then is an overlay-versus-hold chart an evaluation rather than a trading recommendation.
- Rates near 63 switches per year were treated as the near-random region where later overlays were not expected to separate from a full-time hold.
A screen is not an evaluation by itself
Switching rate, as used here, is the observed annual count of direction changes in a signed or ranked return series. It is a persistence screen rather than a trading instruction.
A runs-test Z score is a streak-count diagnostic on an ordered up or down return series. It measures how far the observed run count sits from the count expected under independence, and it is used to judge whether that series looks random and to what degree.
The historical evaluation treated that single statistic as insufficient on its own.
How Osc1 was aligned with the runs Z score
For samples longer than 100 observations, an approximate runs Z score was presented as analogous to an offset-correlation statistic labeled Osc1. Osc1 was written as one minus the expected switching rate divided by the actual switching rate. The expected rate was formed from sample length N and a binary proportion B as N times B times one minus B.
That lag-one Osc1 check is the autocorrelation test in this evaluation. It compares expected and observed switching and is presented as algebraically aligned with the runs Z score except for a square-root-of-time scale.
Where both scores crossed zero
In a 32-fund equity sample covering 10 years, both the runs-test Z score and Osc1 declined as annual switching rate rose. The two scores crossed zero together at a rate of 63.
For 36 equity series from 2/26/93 to 2/18/03, both kurtosis and skew approached zero near an annual switching rate of 63. The evaluation treated that level as a near-random reference.
That near-random-benchmark is the switching-rate level, near 63 per year in this historical sample, where the runs Z score, Osc1, kurtosis, and skew all sit close to zero.
The near-random region for later overlays
Persistence here means a departure from independence in an ordered return series. It is inferred when switching is scarce relative to a random benchmark and when the runs and lag-one diagnostics agree.
The evaluation used annual switching rate as an inverse persistence screen for later overlay tests. Rates near 63 per year were treated as the region where those overlays were not expected to separate from a full-time hold baseline.
Editorial reading: the overlay-versus-hold chart becomes readable as an evaluation only after those two diagnostics have already nulled on the same axis. It is not a trading recommendation.
Walk-forward windows and the rate distribution
A walk-forward check compared optimized and fixed moving-average settings across three contiguous five-year windows. The check used a low-rate series, a mid-rate series near 59, and a near-random series near 63.5.
In a 400-fund frequency count, about 7 percent of long-lived equity series sat below a switching rate of 55. Only one sat below 50. The distribution was described as near-bell-shaped with a mean near 59.5.
Walk-forward MACD annualized return versus buy-and-hold
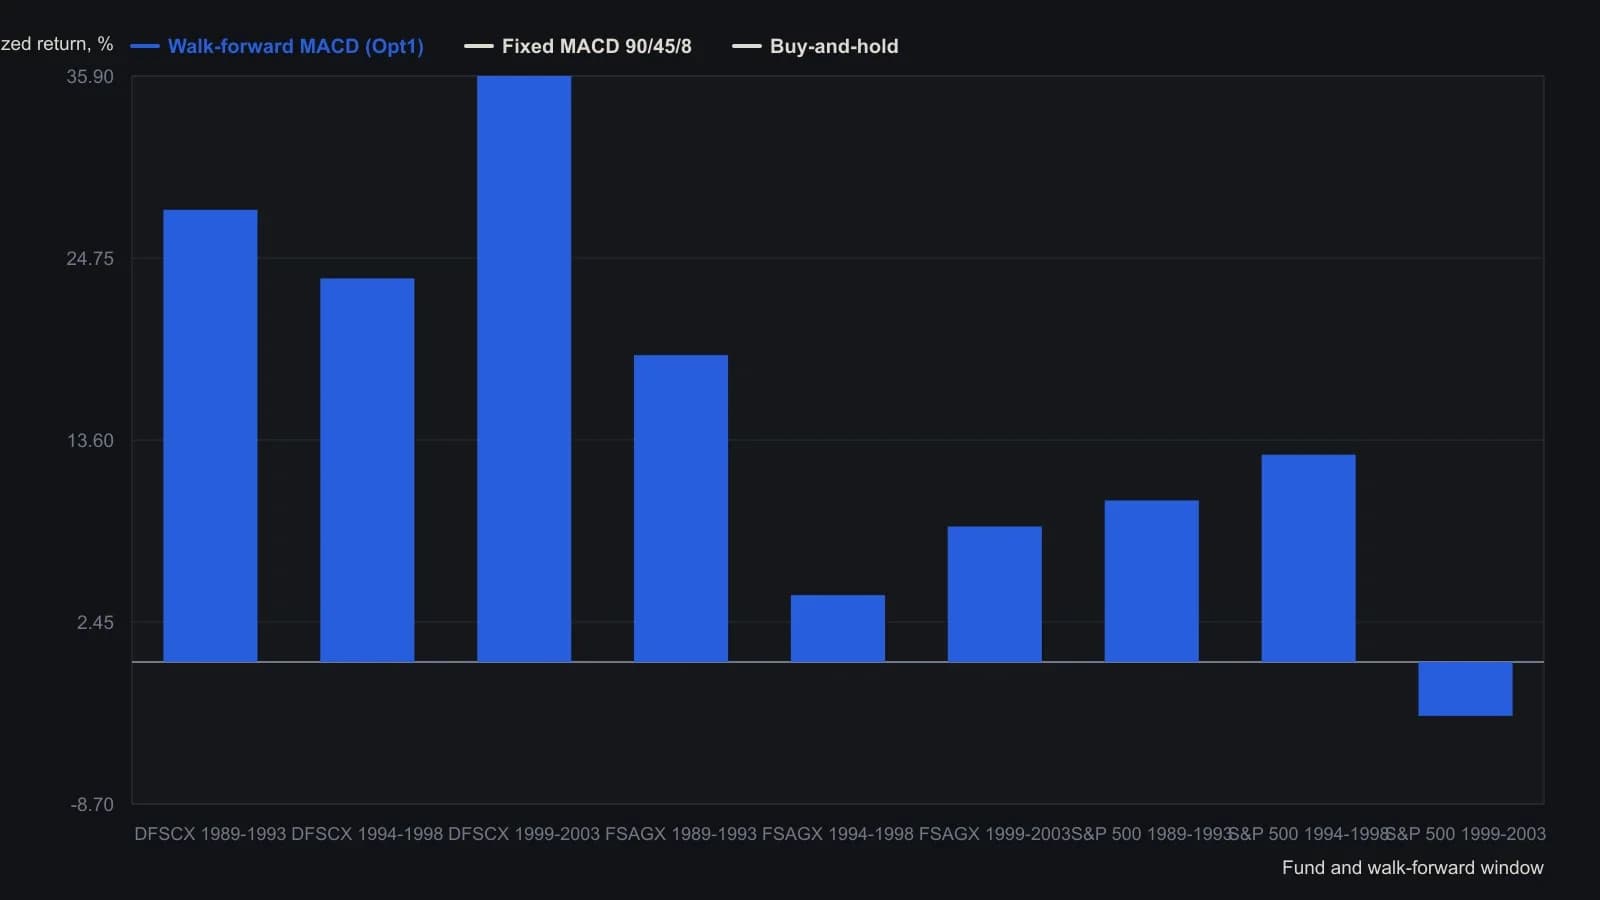
Opt1 parameters were fit in the first window and held later (DFSCX 50/33/3, FSAGX 39/30/18, S&P 500 66/56/48). Later Opt2/Opt3 rows are omitted because those sets have no first-window result.
The square-root-of-time scale
The z-score is the standardized gap between actual and expected run counts. In the long-sample reduction it becomes a switching-rate residual multiplied by the square root of sample length.
A sidebar equates the runs Z score to that scaled residual and states that the runs test matches Osc1 except for the time normalization. At N of 2520 the Z score is about 50 times Osc1, a ratio the historical write-up says is visible in the 32-fund plot.
All readings on this track · 15 readings
- 1986Constructing runs and persistence tests from labeled prices
- 1986Evaluating daily price and volume serial independence windows
- 1986Evaluating advance-decline plus-day runs against chance baselines
- 1986Weekly resamples as a diagnostic filter for statistical windows
- 1988Runs test as a critique of price-series memory
- 1989Evaluating weekday close direction with a counted baseline
- 1989Statistical windows for indicator time parameters
- 1992Channel-height ratios for equity trend evaluation
- 2001A runs test before volatility and expected-value sizing
- 2005Constructing runs-test z-scores for signed return persistence
- 2005Evaluating persistence with runs and autocorrelation
- 2005Weekday FX turning points and close run tests
- 2013Constructing a runs-test turn forecast
- 2017Star rating from slope and swing runs
- 2018Regime-dependent odds after directional price runs