2016issue C0718-20
Nested correction-size bands and a derived support price
Price swings can be grouped by correction depth so several market rhythms run on the same chart. A matching correction stays inside a 20 percent size band; a larger gap starts a new rhythm. Smaller bands are expected to complete first, and subtracting the first correction depth from a later high produces a derived support price for an unmatched larger rhythm.
- Price swings can be grouped by correction depth into correction-size bands so several market rhythms of different sizes can run on the same chart at once.
- A matching correction stays inside a 20 percent band of an earlier pullback, while a size gap of at least 20 percent larger or smaller starts a new rhythm.
- Rhythm completion order expects smaller bands to resolve first, and a derived support price is a later high minus that rhythm's first correction depth.
- On the Apple daily case, the August 2015 drop was treated as a large unmatched correction because the larger 2013-sized rhythm had not yet been matched.
Several rhythms on one chart
Price swings can be grouped by correction depth so several market rhythms of different sizes can run on the same chart at once.
A correction-size band is a grouping of pullbacks whose depths stay inside a stated percentage envelope of one another and therefore belong to the same market rhythm.
Matching corrections and a new rhythm
A correction starts a new rhythm only when its size is at least 20 percent larger or smaller than other correction waves already counted in that trend.
Corrections are treated as similar in size, and therefore as a matching pair inside one rhythm, only when they stay inside a 20 percent band of each other.
A 100-point correction can be matched with an 80-to-120-point pullback, but not with a 75-point or 125-point pullback. The later pullback is a matching correction and is used to mark that cycle as complete.
Rhythm completion order and derived support
Smaller rhythms are expected to complete first, so a 40-point correction should find its matching pullback before a concurrent 100-point rhythm is completed.
After a new high, subtracting the first correction depth of a rhythm from that high produces a candidate support price for that rhythm. That derived support price is used as a candidate buy zone if the larger rhythm is still unmatched.
The Apple daily case
On the Apple daily case, a first-correction depth of 45.71 subtracted from later highs produced a support price of 88.97.
The August 2015 Apple drop was treated as a large unmatched correction, not a new bear trend, because the larger 2013-sized rhythm had not yet been matched.
Apple daily prices around the August 2015 washout
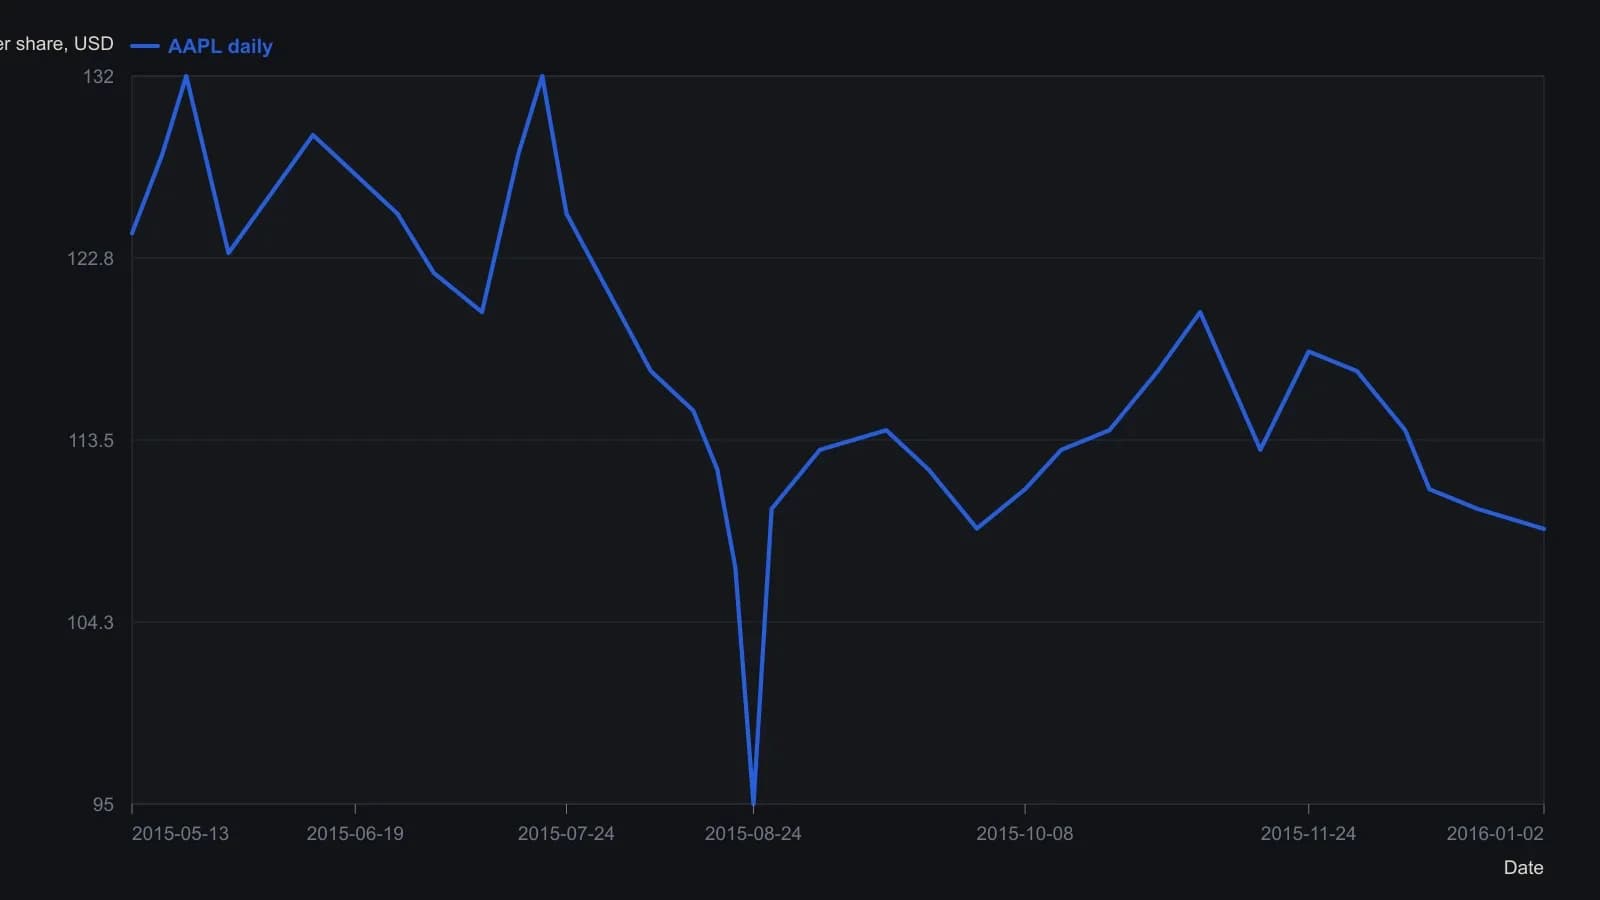
Y-values are typical daily prices digitized from the candlestick raster and rounded to the nearest dollar; only 108.98 is a printed axis tag. The pane has no internal grid, so the August low is placed at the lowest printed tick the wick approaches. Individual open/high/low/close prints are not recovered.
All readings on this track · 16 readings
- 1991Wave counting as a sampling frame for head and shoulders
- 1995Constructing a percent-reversal wave filter
- 1995Filtered waves, overdue duration, candles, and trend
- 1995Filtered swing ledger for MW pattern construction
- 2003Three ratio tests from a completed supercycle
- 2004Wave labels as a checklist for expansion versus contraction
- 2010Constructing wave-ratio signals from a quadratic trend filter
- 2011A temporary placeholder while source evidence is loaded
- 2011Construct a harmonic impulse from measured three-wave limbs
- 2012Three Fibonacci rules to label trend versus countertrend
- 2013Sentiment wave counts before news headlines
- 2013Constructing a 1-2-3 wave count from high-low zigzag swings
- 2013Step candle confirmations with wave count and chandelier exit
- 2016Nested wave rhythms and double-bottom support
- 2016Nested correction-size bands and a derived support price
- 2020Counting a Nasdaq correction before stacking Fibonacci targets