2010issue C0144-47
Constructing wave-ratio signals from a quadratic trend filter
A two-clock construction first recovers a countable swing path with a quadratic-trend-filter, then uses a Fibonacci-style alpha-reading cutoff to accept or reject a one-session Elliott wave long or short. The lesson is a wave-counting claim that can be tested before the next bar.
- Treat each price as a smooth trend plus zero-mean noise, then predict the next trend and correct it as a noise-weighted blend of that prediction and the new price.
- Take the wave count from the filtered trend path rather than from raw noisy prints, treating short runs of up or down sessions as correlated swings.
- Tune the tracking-parameter by scanning values that minimize innovation variance so the filter-gain matches how tightly the quadratic swing model should be obeyed.
- Convert the predicted one-session change into a signed alpha-reading and let a ratio cutoff accept, reject, or flatten the Elliott wave hypothesis for that session.
Two clocks for a testable count
The archive workflow treats wave-and-ratio construction as two clocks that must fire in order. The first clock recovers a countable swing path by predict-and-correct filtering of noisy bars. The second clock lets a Fibonacci-style ratio cutoff decide whether an Elliott wave long or short may stand for one session.
Editorial: the construction is meant to make a wave-counting claim testable before the next bar. It is not a method for decorating a finished chart after the fact.
Predict and correct the trend path
Each observed price can be treated as a smooth trend plus a zero-mean noise term. A two-stage recursion first predicts the next trend value, then forms a corrected trend as a noise-weighted blend of that prediction and the new price.
Short runs of consecutive up or down sessions are treated as evidence that neighboring prices can be correlated rather than independent white-noise increments. Wave-counting then labels sequential up and down legs from the filtered trend path, not from the raw noisy prints.
The next-trend predictor is built from the three prior filtered trend values so that four successive trend points are assumed to lie on a quadratic curve. A process-noise term is allowed as a correction to that curve.
The corrected trend equals the prediction plus a filter-gain times the innovation. The innovation is the portion of the new price that was not already contained in the prior trend prediction, which is the new price minus the prediction. The residual is the gap between the new price and the corrected trend after the update.
Tune the tracking-parameter
Measurement-noise variance is taken from the residual series. Process-noise variance is unknown. The tracking-parameter is the log-ratio of process-noise variance to measurement-noise variance. It is positive when the model is quieter than the data and negative when the model is noisier, in which case the quadratic assumption may need to change.
A scan of tracking-parameter values can select the setting that minimizes innovation variance. On the illustrated daily-open series that setting was 1.86, implying measurement noise about 72 times model noise, and the filter-gain settled near 0.37.
Ford opens versus one-step quadratic-filter forecasts
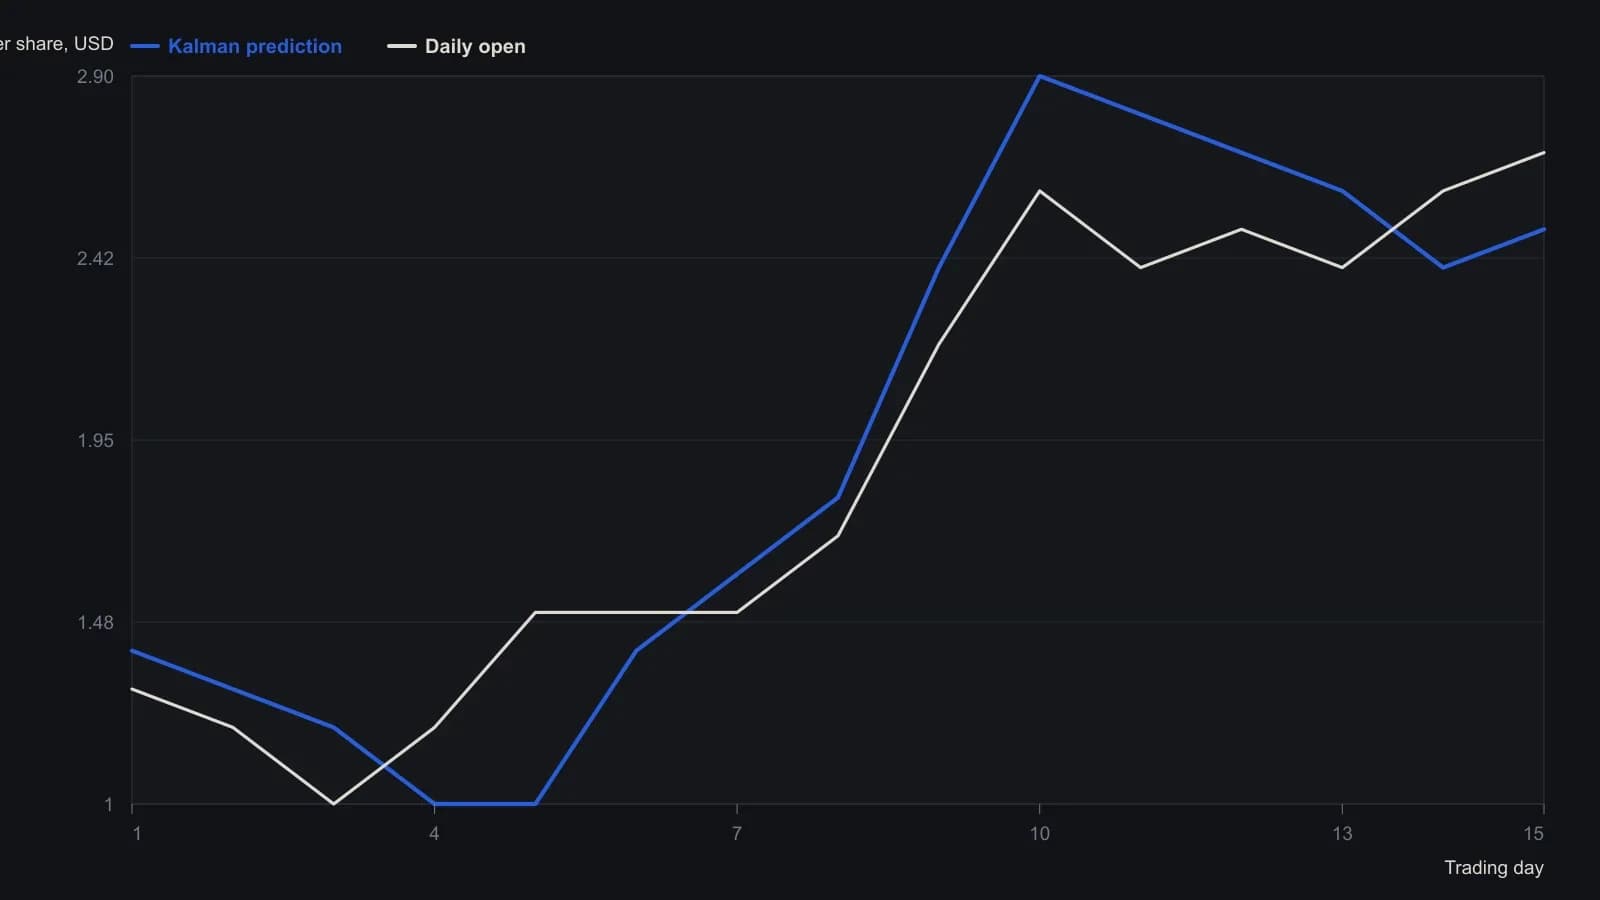
The source held the quadratic predictor x(k|k-1)=3(x(k-1)-x(k-2))+x(k-3) and used tracking parameter T=1.86 on this Ford track.
Convert the alpha-reading into a session hypothesis
A signed alpha-reading is the predicted one-session change divided by that prediction's standard deviation. The sign encodes predicted direction. A magnitude above 1 encodes a predicted change larger than a typical average.
Editorial: this alpha-reading is the working analog of a Fibonacci retracement on the same chart scale. It converts a measured swing into a predicted change divided by its own scale so a cutoff can clear or kill the next-session hypothesis.
A cutoff searched between 0 and 3 converts the alpha-reading into a one-session long, short, or flat hypothesis. The illustrated series marked those cutoffs at 0.38 and -0.38.
The Elliott wave claim here is that one-session long or short, and the ratio cutoff must accept or reject it. The wave count that feeds the claim is taken from the quadratic-trend-filter path, so the hypothesis can be written down before the next bar arrives.
All readings on this track · 16 readings
- 1991Wave counting as a sampling frame for head and shoulders
- 1995Constructing a percent-reversal wave filter
- 1995Filtered waves, overdue duration, candles, and trend
- 1995Filtered swing ledger for MW pattern construction
- 2003Three ratio tests from a completed supercycle
- 2004Wave labels as a checklist for expansion versus contraction
- 2010Constructing wave-ratio signals from a quadratic trend filter
- 2011A temporary placeholder while source evidence is loaded
- 2011Construct a harmonic impulse from measured three-wave limbs
- 2012Three Fibonacci rules to label trend versus countertrend
- 2013Sentiment wave counts before news headlines
- 2013Constructing a 1-2-3 wave count from high-low zigzag swings
- 2013Step candle confirmations with wave count and chandelier exit
- 2016Nested wave rhythms and double-bottom support
- 2016Nested correction-size bands and a derived support price
- 2020Counting a Nasdaq correction before stacking Fibonacci targets