2020issue C1126-31
Counting a Nasdaq correction before stacking Fibonacci targets
A historical Nasdaq daily chart is used as homework: lock impulse-wave and correction-wave rules, then stack independent downside maps so a long setup is considered only where those maps meet a possible wave-C completion.
- Lock impulse-wave and correction-wave rules before targeting. An impulse-wave has five waves with the trend, and a same-degree correction-wave is not counted as five waves.
- After a labeled 5-(5) high, the archive seeks a later upside reversal rather than a long setup at the high.
- Build three independent downside maps first: a measured rectangle, a pitchfork-median, and a fifty-percent-retrace of the larger advance. Add a fibonacci-projection only as a fourth confirmation layer.
- Editorial reading: treat the long idea as valid only if those maps converge near an expected wave-C completion.
Lock the wave rules first
An impulse-wave is described as a five-wave pattern in the trend direction, with three motive legs and two countertrend legs. Waves 1, 3, and 5 may themselves extend as smaller impulses.
Stated impulse guidelines include that wave 2 cannot exceed the start of wave 1, wave 3 is an impulse that is larger than wave 2 and is not the smallest wave, waves 2 and 4 do not overlap, and wave 5 is an impulse or ending wedge.
A correction-wave is framed as a three-wave countertrend structure. Only impulses have five waves, so a same-degree correction cannot be counted as five waves, and a lone five-wave impulse cannot finish a correction.
The historical Nasdaq chart
On the December 19, 2018 Nasdaq CFD daily chart, price is labeled at a 5-(5) high and then a decline. A long setup is sought near a later upside reversal rather than at the high.
The wave-count after the high
The wave-count after the 5-(5) high is presented as impulse 1-5 into the high, then a-down, b-up of about 50 percent of a, and c that undercuts a to complete a larger A. B then advances into stacked moving-average and volatility-band resistance, which is the dynamic-support-resistance layer on this chart, followed by an expected c-C.
From the c-(4) low the later advance is counted as blue 1, a small 2, an extended red 1-5 inside blue 3, then 4 and a last 5 that also completes a higher-degree (5). A still-higher [5] is expected only after a [4] correction.
Stack independent downside maps
Three independent downside targets are constructed for the same correction: a rectangle equal to the first decline from 5-(5) to c-A, a pitchfork-median from c-A, B, and prior top b, and a fifty-percent-retrace of the February 2016 to August 2019 advance.
Fibonacci ratios are introduced as a fourth confirmation layer. A fibonacci-projection is used for the remaining downward projection only after the rectangle, pitchfork-median, and fifty-percent-retrace targets are already in place.
Nasdaq CFD daily from the August 2018 impulse top into the correction
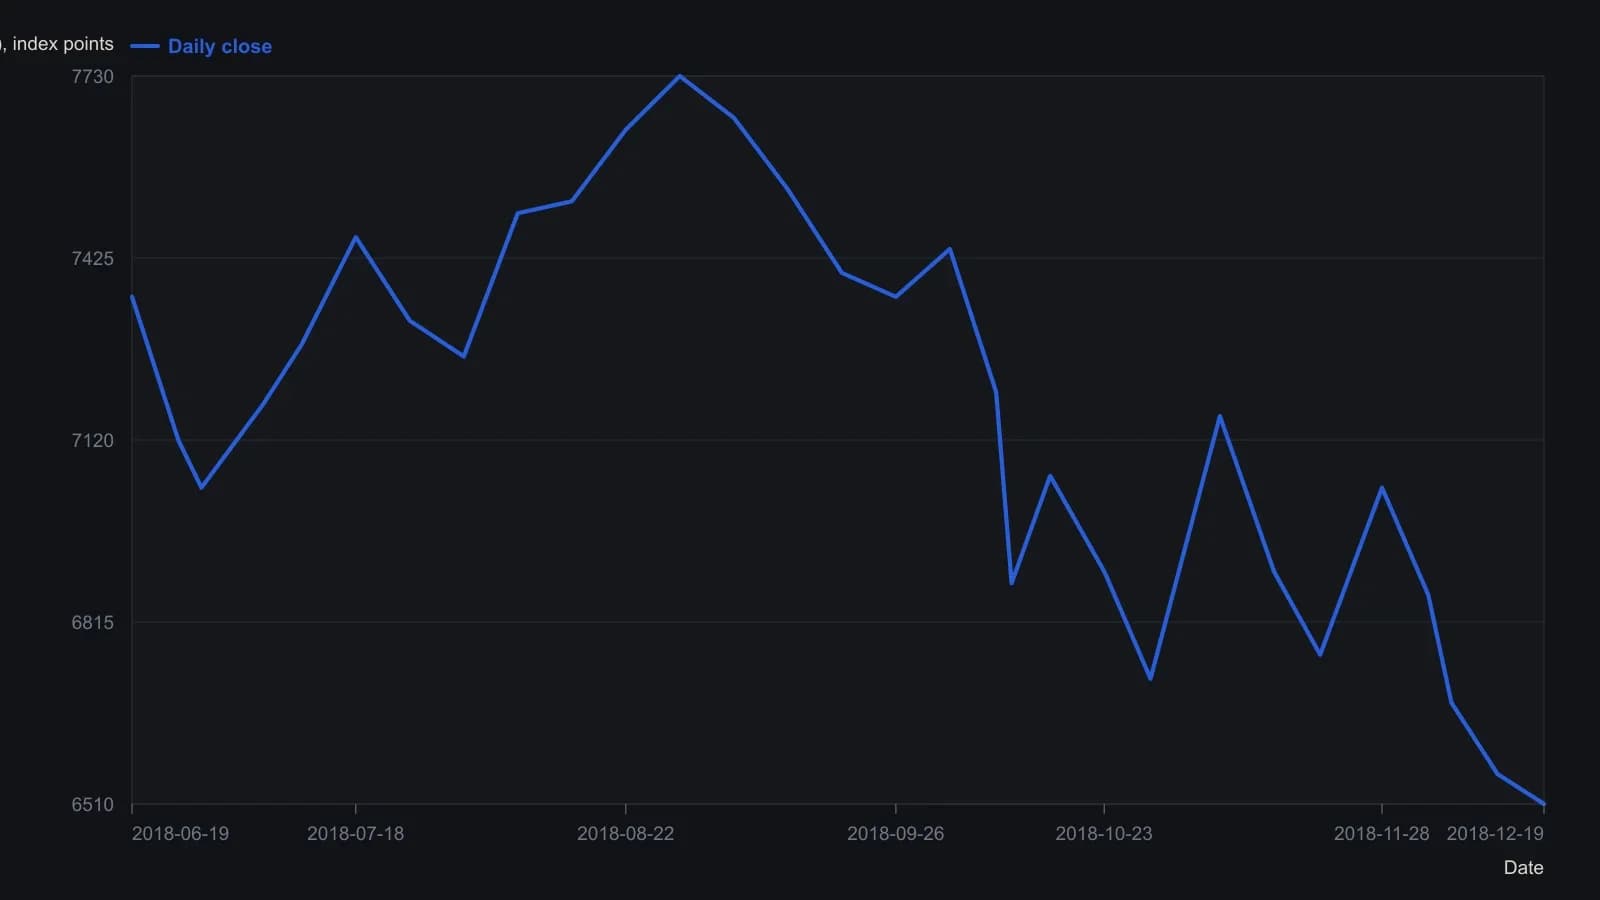
Closes are approximate reads from the daily candlestick raster, rounded to about 20–40 index points. The source moving averages, volatility channel, and wave labels are not redrawn. The printed last bar is 19 December 2018; the figure’s date axis is labelled through 13 December.
All readings on this track · 16 readings
- 1991Wave counting as a sampling frame for head and shoulders
- 1995Constructing a percent-reversal wave filter
- 1995Filtered waves, overdue duration, candles, and trend
- 1995Filtered swing ledger for MW pattern construction
- 2003Three ratio tests from a completed supercycle
- 2004Wave labels as a checklist for expansion versus contraction
- 2010Constructing wave-ratio signals from a quadratic trend filter
- 2011A temporary placeholder while source evidence is loaded
- 2011Construct a harmonic impulse from measured three-wave limbs
- 2012Three Fibonacci rules to label trend versus countertrend
- 2013Sentiment wave counts before news headlines
- 2013Constructing a 1-2-3 wave count from high-low zigzag swings
- 2013Step candle confirmations with wave count and chandelier exit
- 2016Nested wave rhythms and double-bottom support
- 2016Nested correction-size bands and a derived support price
- 2020Counting a Nasdaq correction before stacking Fibonacci targets