1993issue C021-7
A three-sleeve regime map for equities, rates, and futures
A single-market idea stays unfinished until it can be placed on a three-sleeve regime map. This archive case study sizes the equity sleeve from a dividend-ratio window, then splits leftover capital between government interest income and an independent trading sleeve.
- Treat any single-market idea as unfinished until equity, rate, and trading-vehicle weights sit on one regime map.
- Asset allocation in this workflow is sequential: a dividend-ratio regime sets the equity sleeve, then leftover capital is split equally between interest income and an uncorrelated trading sleeve.
- Diversification here means the trading sleeve runs independently, adding its own path rather than hedging stocks or rates.
- Seasonal analysis in this setting is a multi-quarter read of valuation and prime-rate windows that retunes sleeve weights over weeks to several quarters.
A single-market idea stays unfinished without a three-sleeve map
This archive case study treats a single-market idea as unfinished until it can be placed on a three-sleeve regime map. The illustrated book was built from three vehicle classes: equities, government interest income, and a trading sleeve of markets described as neither positively nor negatively tied to stocks or rates.
Editorial reading: the map is a sequential weighting process. A dividend-ratio regime first sizes the equity sleeve. Leftover capital is then split equally between a government interest-income sleeve and an uncorrelated trading sleeve. Those weights are retuned as valuation and lending-rate regimes move over weeks to several quarters. That teaching frame is editorial and is not a claim from the archive.
The trading sleeve is independent, not a hedge
The trading sleeve was specified to run independently of the other sleeves, not as a hedge that would transfer both risk and profit potential away from the equity or rate holdings. The designer argued that adding those non-correlated futures on margin, if sized conservatively, was meant to cut downside swings in the combined path rather than raise them.
Diversification in this book therefore means holding equities, government bills or bonds, and futures markets specified as neither positively nor negatively tied to stocks or rates, so the trading sleeve adds an independent return path rather than hedging the other sleeves.
Equity size follows a dividend-ratio regime
Equity timing and size used a single valuation tool: the 30-stock industrial average versus the trailing four-quarter dividend total of its members, with exposure trimmed as that ratio rose and added as it fell. In the sample described, a ratio above 30 times trailing twelve-month dividends coincided with a major equity top inside a two- to six-quarter window on all 12 prior occasions.
The allocation rules committed 80 percent of the book to equities when the ratio was below 18, and placed 20 percent back into equities after the ratio recrossed below 30. The equity sleeve was a buy-and-hold basket of at least eight large-cap names from that average with betas near 1, not a stock-picking book.
DJIA versus 12-month dividend ratio, 1980–1992
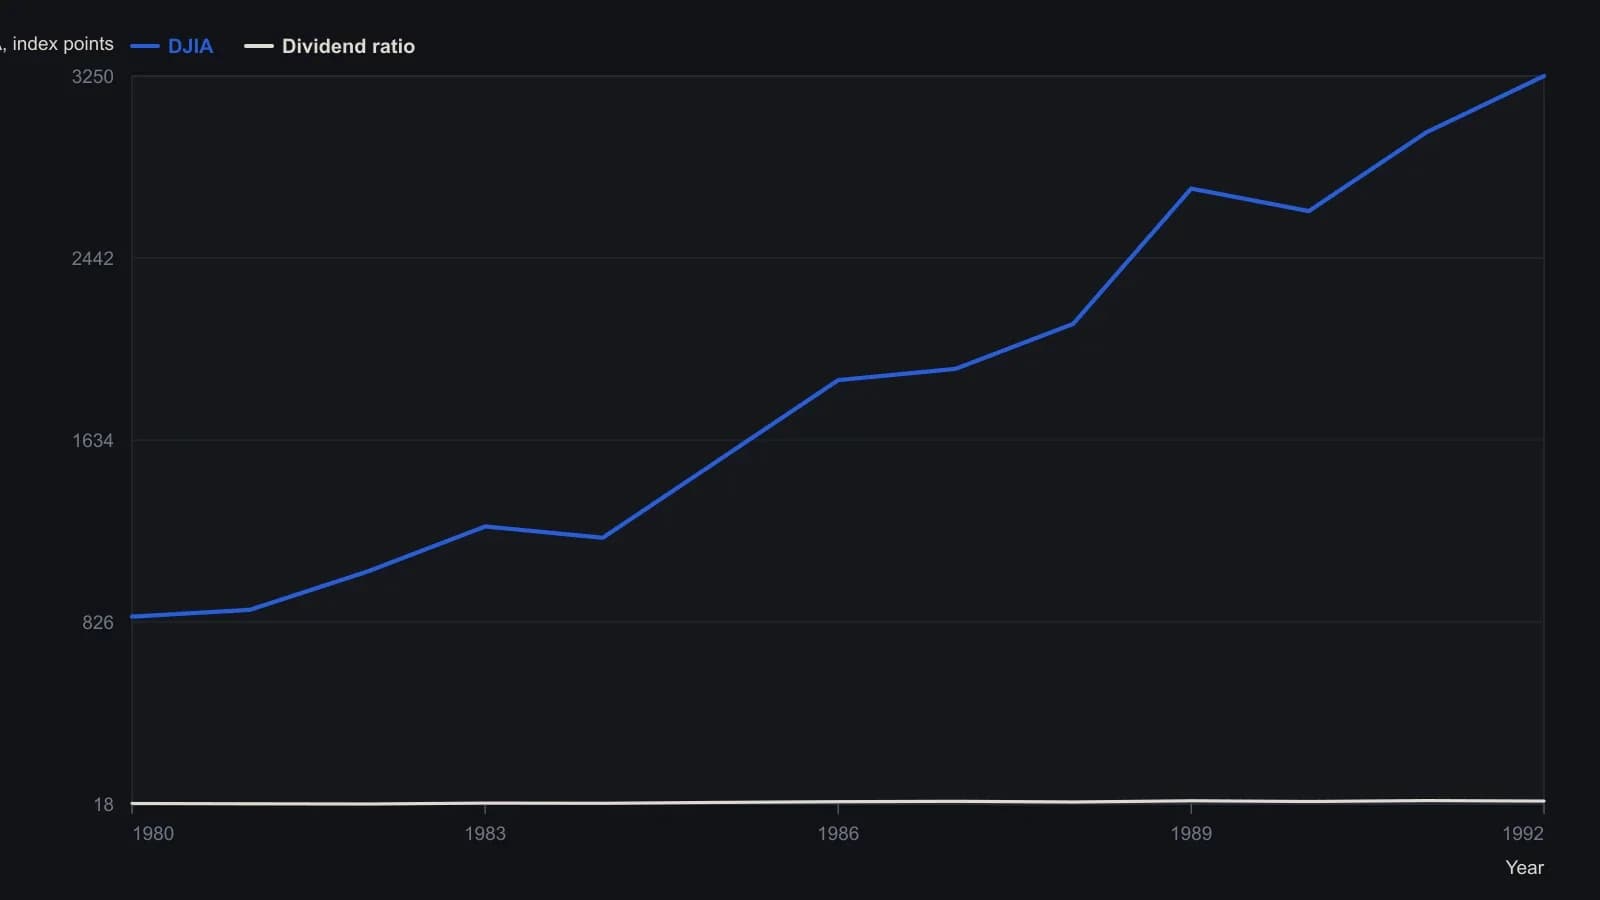
The source treats the ratio of DJIA to the prior four quarters of dividends as the sole equity-timing tool. It reports a print above 30 marked a major top within two to six quarters on 12 of 12 earlier occasions, with a 13th print at the end of 1991 Q3. Raster labels are inverted; year ticks and both scales were read after rotating the figure.
Leftover capital follows a prime-rate switch and an equal split
After the equity weight was set, half of leftover capital went to interest income and half to the trading sleeve. Unused futures margin was parked in 90-day bills. The interest-income sleeve switched between 30-year government bonds and 90-day bills on the first uptick or downtick in the prime lending rate, accepting some whipsaw in exchange for a simple duration-regime flip.
Editorial reading: seasonal analysis here is a reading of multi-quarter valuation and rate-regime windows. Sleeve weights move over weeks to several quarters, with a shorter horizon inside the leveraged trading sleeve, to decide when to add, trim, or rotate capital. That wording is editorial. The archive itself shows reallocations marked when the dividend ratio or the prime-rate direction changed, and notes that results shown before the design date were reconstructed with hindsight for illustration.
All readings on this track · 26 readings
- 1990Stress-testing a futures sleeve across equity regimes
- 1990Staged sleeves from one equity forecast
- 1990Score a trade after allocation, diversification, and a drawdown limit
- 1993A three-sleeve regime map for equities, rates, and futures
- 1994Late-cycle breadth as an allocation exam
- 1994Ratio MACD crossover as a portfolio weight filter
- 1995Sizing a trend futures sleeve in a 1995 policy shift
- 1996A 1990s case on liquidity cycles, rank rotation, and cross-market sleeves
- 1997Regime-aware allocation versus binary timing
- 1998Hedge-fund sleeves under a hard drawdown limit
- 2010True diversification as portfolio construction
- 2012Regime-gated trend baskets and layered sizing
- 2013Score fund cost drag before the equity-versus-defensive mix
- 2013Cost-first fund mix in portfolio construction
- 2015Cost-first fund construction and the stock-bond mix
- 2016Audit the fund cost-stack, then set the sleeve-mix
- 2016Read fund listings through costs, then allocation, then diversification
- 2017A four-channel own-account book with signal-replacement
- 2017Listed REITs as a standalone portfolio sleeve
- 2017Cost-first stock and bond fund construction
- 2017Cost-first fund mix in a diversified portfolio
- 2018Mutual-fund costs come before returns in portfolio mixes
- 2018Cost gates before a stock-bond fund mix
- 2019Cost-stack and bond-equity mix around a trade
- 2019Evaluate diversification by correlation, not by the mix label
- 2020Cost-first fund sleeves and a stock-bond mix