1998issue C031-4
Hedge-fund sleeves under a hard drawdown limit
A 1990s educational case treated managed futures and hedge-fund styles as alternative sleeves beside stocks and bonds when those markets look more volatile or weaker than their usual record, then ranked styles by return against the size of their drawdowns.
- A 1990s educational case treated managed futures and hedge funds as alternative sleeves meant to sit beside stocks and bonds when those markets look more volatile or weaker than their usual record.
- Noncorrelated sleeves were meant to offset losses elsewhere and produce a smoother multi-year equity path than a single-asset book.
- Published top-20 rankings compared annualized return with maximum peak-to-trough decline and total return with the sum of the period's 12 largest drawdowns, and warned that past figures do not indicate later results.
- Editorial reading: ask how each style's loss path would change the rest of the book, then size only the sleeves whose historical drawdowns stay inside a hard equity limit.
Sleeves beside stocks and bonds
A 1990s educational case treated managed futures and hedge funds as alternative sleeves meant to sit beside stocks and bonds when those markets look more volatile or weaker than their usual record.
The construction logic was that noncorrelated sleeves should offset losses elsewhere and produce a smoother multi-year equity path than a single-asset book.
Managed futures were described as discretionary commodity trading advisors that can go long or short across more than 100 financial and commodity markets, so a move in any one market can still be a source of P&L.
Hedge-fund styles in the case were grouped by process, including event-driven, distressed, risk-arbitrage, fund-of-funds, global, global-macro, market-neutral, long/short, several arbitrage sleeves, short-selling, and sector books.
Published style rankings
For July 1994 to June 1996, published top-20 averages were 18.3% a year with a 3% largest drawdown for event-driven funds, 16.1% with 1.7% for funds of funds, 28.4% with 4.7% for global funds, 19.4% with 12% for global macro, and 16.1% with 0.2% for market-neutral funds.
A later three-year window to June 1997 showed the same top-20 market-neutral group with a 57% total return, a worst decline under 1%, and a total of all drawdowns also under 1%. After a risk-free adjustment the return-to-drawdown ratio was 86 to 1.
In that same later window the top-20 fund-of-funds group showed a 58% total return, a 1.7% average worst decline, 3.2% as the total of all drawdowns, and a 33-to-1 return-to-drawdown ratio after the same risk-free adjustment.
Three-year drawdowns and returns by hedge-fund style
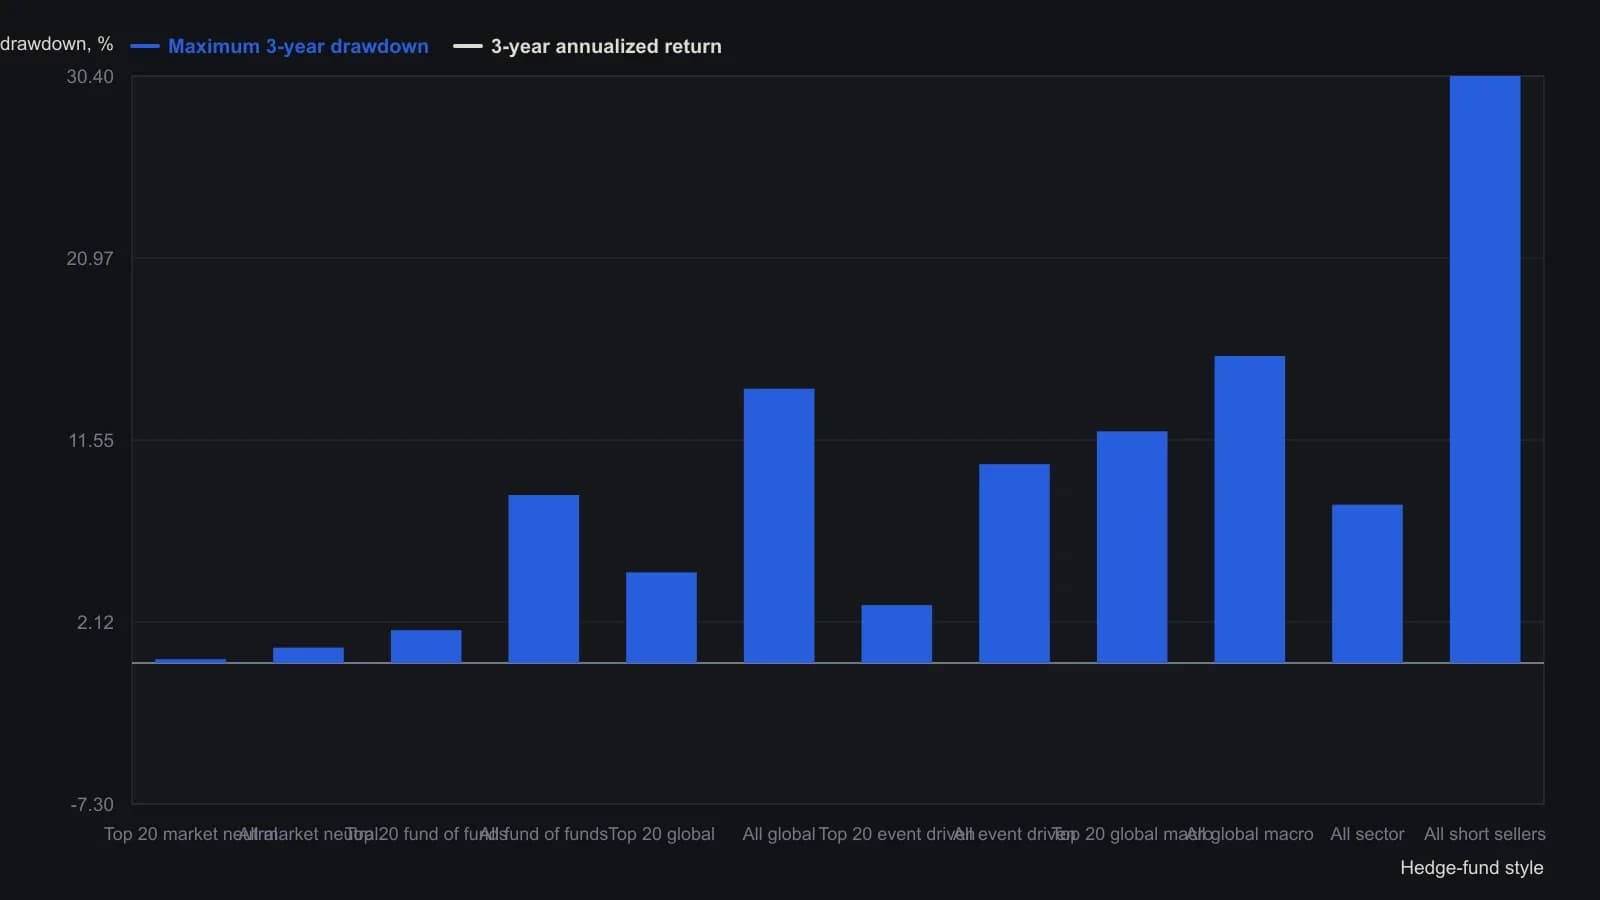
HFCI three-year window July 1994 to June 1997. Sector and short-seller rows are all-fund averages only; other styles show both the top-20 cut and the all-fund average. Maximum drawdown is the worst peak-to-trough decline in that window. The source warns that past results do not indicate future results.
How styles were compared
The ranking method compared annualized return with maximum peak-to-trough decline and also compared total return with the sum of the period's 12 largest drawdowns, then warned that past figures do not indicate later results.
Style notes in the case said market-neutral books try to cancel market risk and then live or die on stock selection, while short-seller sleeves were framed as an overlay for accounts already heavily long equities.
All readings on this track · 26 readings
- 1990Stress-testing a futures sleeve across equity regimes
- 1990Staged sleeves from one equity forecast
- 1990Score a trade after allocation, diversification, and a drawdown limit
- 1993A three-sleeve regime map for equities, rates, and futures
- 1994Late-cycle breadth as an allocation exam
- 1994Ratio MACD crossover as a portfolio weight filter
- 1995Sizing a trend futures sleeve in a 1995 policy shift
- 1996A 1990s case on liquidity cycles, rank rotation, and cross-market sleeves
- 1997Regime-aware allocation versus binary timing
- 1998Hedge-fund sleeves under a hard drawdown limit
- 2010True diversification as portfolio construction
- 2012Regime-gated trend baskets and layered sizing
- 2013Score fund cost drag before the equity-versus-defensive mix
- 2013Cost-first fund mix in portfolio construction
- 2015Cost-first fund construction and the stock-bond mix
- 2016Audit the fund cost-stack, then set the sleeve-mix
- 2016Read fund listings through costs, then allocation, then diversification
- 2017A four-channel own-account book with signal-replacement
- 2017Listed REITs as a standalone portfolio sleeve
- 2017Cost-first stock and bond fund construction
- 2017Cost-first fund mix in a diversified portfolio
- 2018Mutual-fund costs come before returns in portfolio mixes
- 2018Cost gates before a stock-bond fund mix
- 2019Cost-stack and bond-equity mix around a trade
- 2019Evaluate diversification by correlation, not by the mix label
- 2020Cost-first fund sleeves and a stock-bond mix