1990issue C031-10
Staged sleeves from one equity forecast
A historical workflow mapped one intermediate-term equity forecast into cash-versus-equity actions. The same score supported staged sleeves, a crash-sensitive exit, and a tighter paper replica used as a quality-control-overlay.
- Diversification, strategic-asset-allocation, and tactical-asset-allocation were kept as separate ideas, not as one switch between cash and stock.
- A mechanical-allocation-rule can commit staged-sleeves at successive forecast-threshold levels instead of using market-timing that jumps between a full equity book and full cash.
- A cash-out forecast-threshold set too deep can keep the book invested through a crash that a shallower exit would have left before.
- A quality-control-overlay is a tighter paper replica of the same rules, read as an early warning if that pair takes a significant real loss.
Three ideas kept apart
The archive separated three portfolio ideas. Diversification meant holding many similar names so that risk unique to any one security was reduced. Strategic-asset-allocation meant a low-turnover mix across asset classes, chosen so that a decline in one class would not dominate the whole book. Tactical-asset-allocation meant changing the weight of two or more asset classes when perceived value or price trend changed.
The mechanical allocator was specified as a two-asset problem: cash versus a U.S. equity book assumed to move with a broad large-cap index.
A forecast turned into buy and sell levels
The forecast was described as an intermediate-term multiple regression of market outcomes on a large library of fundamental series. That score was then turned into paired buy and sell levels inside a strategy simulator.
A buy-and-hold reconstruction set the buy forecast-threshold so the book was invested at the start of the sample window and the sell forecast-threshold so that no exit fired, because the most negative forecast in the sample never reached it.
The baseline rule pair entered long on a positive forecast and exited on a negative forecast. A later table listed many long-only, unlevered, no-stop variants, with more demanding buy levels and more tolerant sell levels. Across that grid, completed buy-and-sell round turns were few, and wider gaps between the entry and exit levels produced fewer trades.
Staged sleeves as the general case
All-in cash-or-stock switching was treated as a special case of tactical-asset-allocation. That special case is market-timing: a jump between a fully invested equity book and fully invested cash.
The staged alternative committed a staged-sleeve at successively higher forecast-threshold levels and unwound those sleeves at successively more negative levels. Each staged-sleeve was a fixed fraction of the book, often one-quarter, with its own forecast pair rather than one all-in switch. The book became fully invested only after the last buy sleeve was filled, and fully in cash only after the last sell sleeve was withdrawn.
The archive advised against deepening the cash-out forecast-threshold. A deeper exit would have remained invested through a major crash in the sample, whereas the shallower exits would have left before that peak.
A paper replica as quality control
A paper-only pair with a milder buy forecast-threshold and a tighter sell forecast-threshold was proposed as a quality-control-overlay. It was a tight-threshold replica of the same mechanical rules, used only on paper. It completed more trades over the same long window, with holds that ranged from very short to well over a year. A significant real loss on that tight pair was to be read as evidence the equation had failed.
The archive warned that inventing more complex rules from the tabulated grids was back-fitting unlikely to travel to other periods. The staged-versus-baseline comparison assumed the forecast was run daily with trades placed the following day. Forecast level, current exposure, and that execution lag together defined the mechanical-allocation-rule, including the choice to stay in cash.
Annualized compound return versus buy-forecast threshold
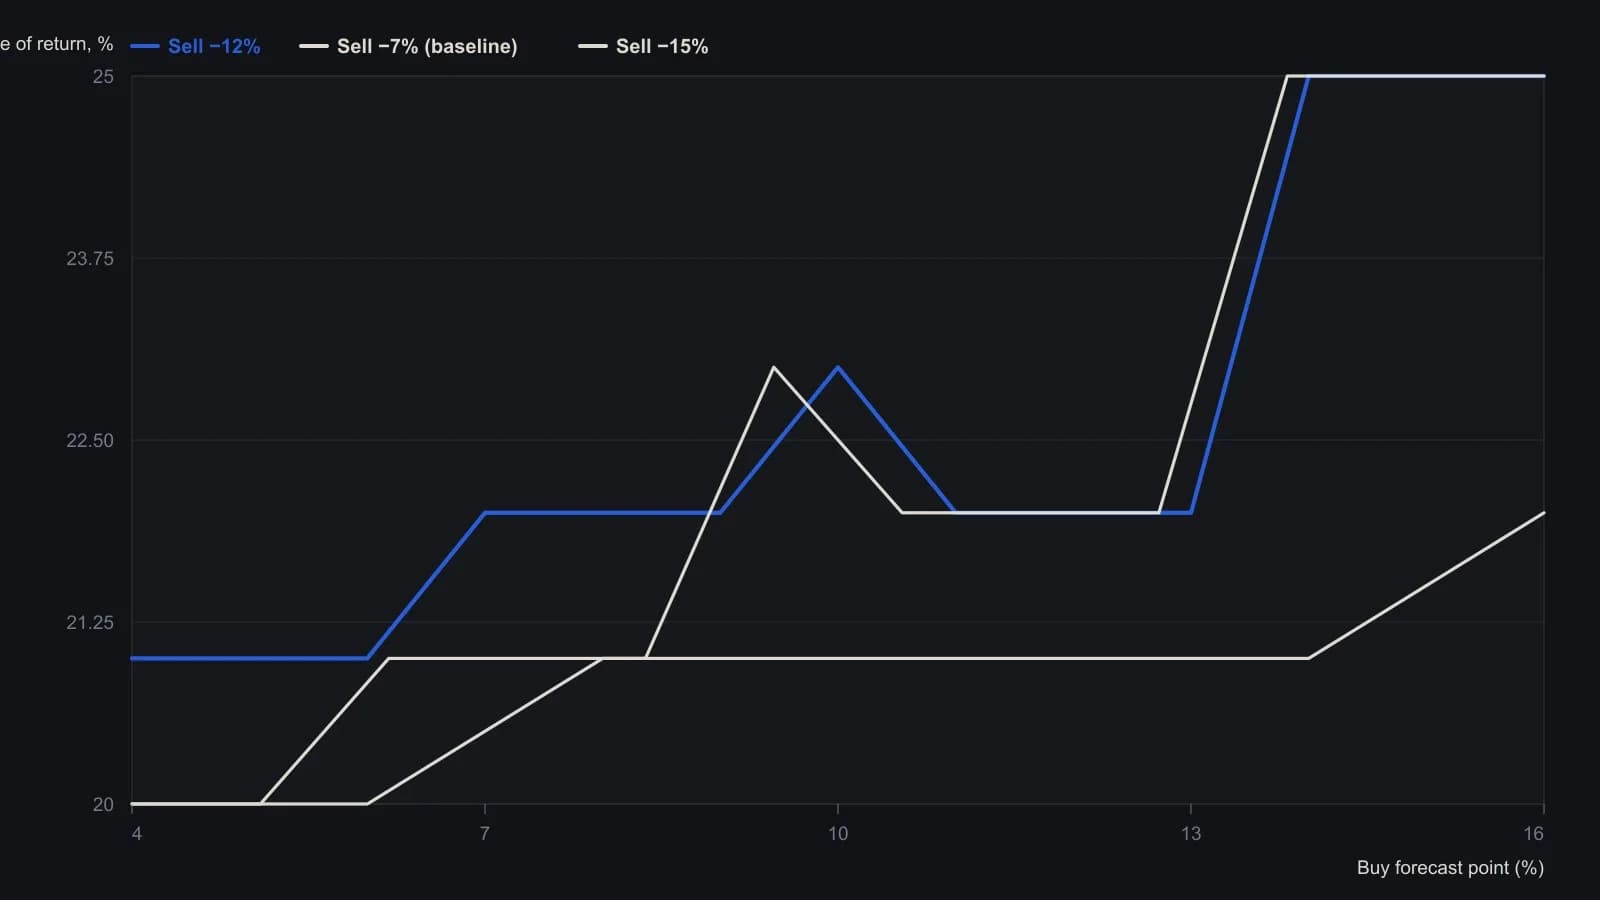
Market Forecaster 3.0, long only, no leverage, no stops. Source printed whole percents. Sell −17% stayed invested through the 1987 crash at 15%; buy-and-hold (−1% buy / −27% sell) printed 13%. The extra yield at deep sells and high buys is the 1987 hang-on the author warns against.
All readings on this track · 26 readings
- 1990Stress-testing a futures sleeve across equity regimes
- 1990Staged sleeves from one equity forecast
- 1990Score a trade after allocation, diversification, and a drawdown limit
- 1993A three-sleeve regime map for equities, rates, and futures
- 1994Late-cycle breadth as an allocation exam
- 1994Ratio MACD crossover as a portfolio weight filter
- 1995Sizing a trend futures sleeve in a 1995 policy shift
- 1996A 1990s case on liquidity cycles, rank rotation, and cross-market sleeves
- 1997Regime-aware allocation versus binary timing
- 1998Hedge-fund sleeves under a hard drawdown limit
- 2010True diversification as portfolio construction
- 2012Regime-gated trend baskets and layered sizing
- 2013Score fund cost drag before the equity-versus-defensive mix
- 2013Cost-first fund mix in portfolio construction
- 2015Cost-first fund construction and the stock-bond mix
- 2016Audit the fund cost-stack, then set the sleeve-mix
- 2016Read fund listings through costs, then allocation, then diversification
- 2017A four-channel own-account book with signal-replacement
- 2017Listed REITs as a standalone portfolio sleeve
- 2017Cost-first stock and bond fund construction
- 2017Cost-first fund mix in a diversified portfolio
- 2018Mutual-fund costs come before returns in portfolio mixes
- 2018Cost gates before a stock-bond fund mix
- 2019Cost-stack and bond-equity mix around a trade
- 2019Evaluate diversification by correlation, not by the mix label
- 2020Cost-first fund sleeves and a stock-bond mix