1990issue C011-10
Stress-testing a futures sleeve across equity regimes
A yearly reset mix of 90 percent equity-index and 10 percent managed futures is judged on a long quarterly curve, in strong and weak equity windows, and after fading only the core return. The sleeve is treated as uncorrelated with the core, not as a reliable opposite move.
- The case mix was reset each year at 90 percent equity-index and 10 percent managed futures, with a 4 percent imputed-dividend chosen high so the equity side would not be understated.
- On the long quarterly curve, adding futures first cut risk up to about a 10 percent weight, the efficient-frontier-nose, and the 10 to 20 percent band stayed at or below index-only risk through the even-risk-mix.
- When equities outpaced futures, the curve flattened. A two-year stretch of a strong index made almost any futures weight lower return and raise risk. The next two years flipped the averages and restored a nose near 10 percent.
- A variational-return-fade that left volatility untouched showed a 10 percent sleeve adding little at high core returns and about eight times the core at the low end. The streams were treated as an uncorrelated-sleeve and gated by a reward-to-variability-screen.
Hold one mix still
The case mix was reset each year at 90 percent equity-index and 10 percent managed futures. A 4 percent imputed-dividend was added to the index, chosen high so the equity side would not be understated when the sleeve was judged. That mix was then read three ways: on a long-sample risk-return curve, inside strong versus weak equity windows, and after fading only the core return while leaving its volatility untouched.
A long-sample risk-return curve
From the fourth quarter of 1973 through the first quarter of 1989, the quarterly index return averaged 3.52 percent including that dividend. The futures sleeve averaged 21.53 percent. Standard deviations were 9.33 and 53.89. The correlation was -0.22.
On that long quarterly risk-return curve, adding futures first cut risk up to about a 10 percent weight and raised risk beyond it. That turn is the efficient-frontier-nose. The 10 to 20 percent band was the range where a more cautious mix still sat at or below index-only risk. The upper end of that band is the even-risk-mix: the higher satellite weight at which total risk returns to the core-only level after first falling.
58-quarter mixes of CMSC futures and the S&P 500
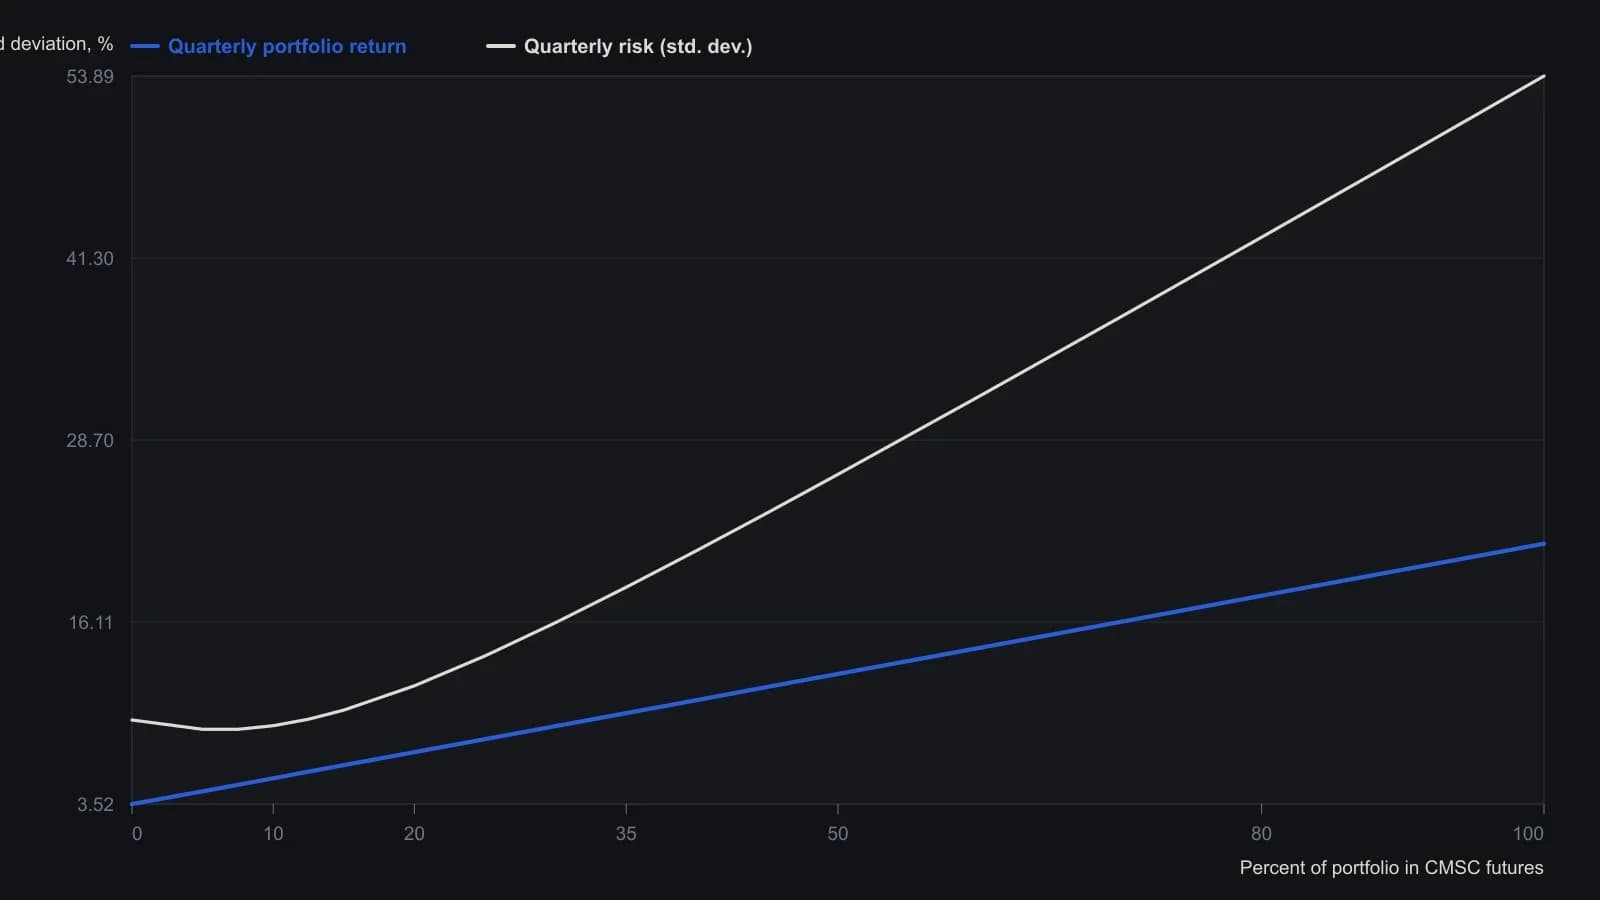
S&P quarterly returns impute a 4 percent annual dividend and omit equity transaction costs; CMSC returns are already net of fees and costs. Sample is 58 quarters, fourth quarter 1973 through first quarter 1989. Source correlation is −0.22.
Strong versus weak equity windows
A five-year window from April 1984 through March 1989, when equities outpaced futures, produced a flatter curve. The nose sat near 15 percent futures. Equal risk sat near 25 percent. Extra return at the nose was only about 4 percent, and the risk cut was only 4 percent.
From April 1985 through March 1987 the index averaged 2.8 percent a month versus 0.83 percent for futures. Any futures weight lowered net return, and almost every weight raised risk.
From April 1987 through March 1989 the monthly averages flipped to 0.88 percent for the index and 2.89 percent for futures. That window restored a nose near 10 percent futures and equal risk near 20 percent.
Fade the core, keep the volatility
Holding 1980 through 1988 index volatility fixed, quarterly equity return was stepped from 4.585 percent down to 0.085 percent. That is a variational-return-fade: a what-if that steps core returns down while leaving observed volatility in place, to see when the sleeve begins to dominate. A 10 percent futures sleeve added only about 5 percent at the high end, but about eight times the core return at the low end.
An uncorrelated sleeve, not an opposite one
The two return streams were treated as uncorrelated, not reliably opposite. A weak equity year improved mainly when the sleeve had a higher average return. That is an uncorrelated-sleeve: a satellite that is not reliably opposite the core, yet can still help a weak year if its own average return is higher.
The add-sleeve screen compared the futures mean-to-volatility ratio with the equity ratio scaled by their correlation. That reward-to-variability-screen says to add the satellite only while its mean-to-volatility ratio exceeds the core ratio scaled by their correlation. Editorial: the screen is a gate used in the archive workflow. It is not a claim that the sleeve will move against the core.
All readings on this track · 26 readings
- 1990Stress-testing a futures sleeve across equity regimes
- 1990Staged sleeves from one equity forecast
- 1990Score a trade after allocation, diversification, and a drawdown limit
- 1993A three-sleeve regime map for equities, rates, and futures
- 1994Late-cycle breadth as an allocation exam
- 1994Ratio MACD crossover as a portfolio weight filter
- 1995Sizing a trend futures sleeve in a 1995 policy shift
- 1996A 1990s case on liquidity cycles, rank rotation, and cross-market sleeves
- 1997Regime-aware allocation versus binary timing
- 1998Hedge-fund sleeves under a hard drawdown limit
- 2010True diversification as portfolio construction
- 2012Regime-gated trend baskets and layered sizing
- 2013Score fund cost drag before the equity-versus-defensive mix
- 2013Cost-first fund mix in portfolio construction
- 2015Cost-first fund construction and the stock-bond mix
- 2016Audit the fund cost-stack, then set the sleeve-mix
- 2016Read fund listings through costs, then allocation, then diversification
- 2017A four-channel own-account book with signal-replacement
- 2017Listed REITs as a standalone portfolio sleeve
- 2017Cost-first stock and bond fund construction
- 2017Cost-first fund mix in a diversified portfolio
- 2018Mutual-fund costs come before returns in portfolio mixes
- 2018Cost gates before a stock-bond fund mix
- 2019Cost-stack and bond-equity mix around a trade
- 2019Evaluate diversification by correlation, not by the mix label
- 2020Cost-first fund sleeves and a stock-bond mix