2003issue C031-10
Sliding-window retracements on the relative strength index
A sliding lookback window on the relative strength index can replace a one-time visual pick of oscillator high and low when retracement levels are drawn. Those levels come from the window range and can be plotted as rolling traces, as fixed percentage guides, or from stored high and low coefficients.
- A sliding lookback window on the RSI series can replace a one-time visual pick of oscillator high and low when drawing retracement levels.
- Retracement levels on RSI are computed from the difference between the window high and window low, then offset from the window low by selected percentages.
- Plotting those levels as a rolling window rather than as fixed lines from a completed range produces jagged traces whenever a new RSI extreme appears inside the window.
- A second construction overlays fixed percentage guides on a 14-period RSI, and another stores an observed RSI high and low as coefficients before multiplying the range by each selected percentage.
The oscillator as a local range
The relative strength index is a bounded oscillator built from a defined lookback of closing prices. In this workflow it is used as the series whose own high and low define a local range.
Fibonacci retracement is applied as percentage distances on that oscillator range rather than on price. The same high-low window then yields a set of horizontal reference levels.
A sliding lookback window on the RSI series can replace a one-time visual pick of oscillator high and low when drawing those retracement levels.
How the levels are placed
Retracement levels on RSI are computed from the difference between the window high and window low, then offset from the window low by selected percentages.
Plotting those levels as a rolling window rather than as fixed lines from a completed range produces jagged traces whenever a new RSI extreme appears inside the window.
Sliding-window Fibonacci levels on daily E-mini S&P 500 RSI
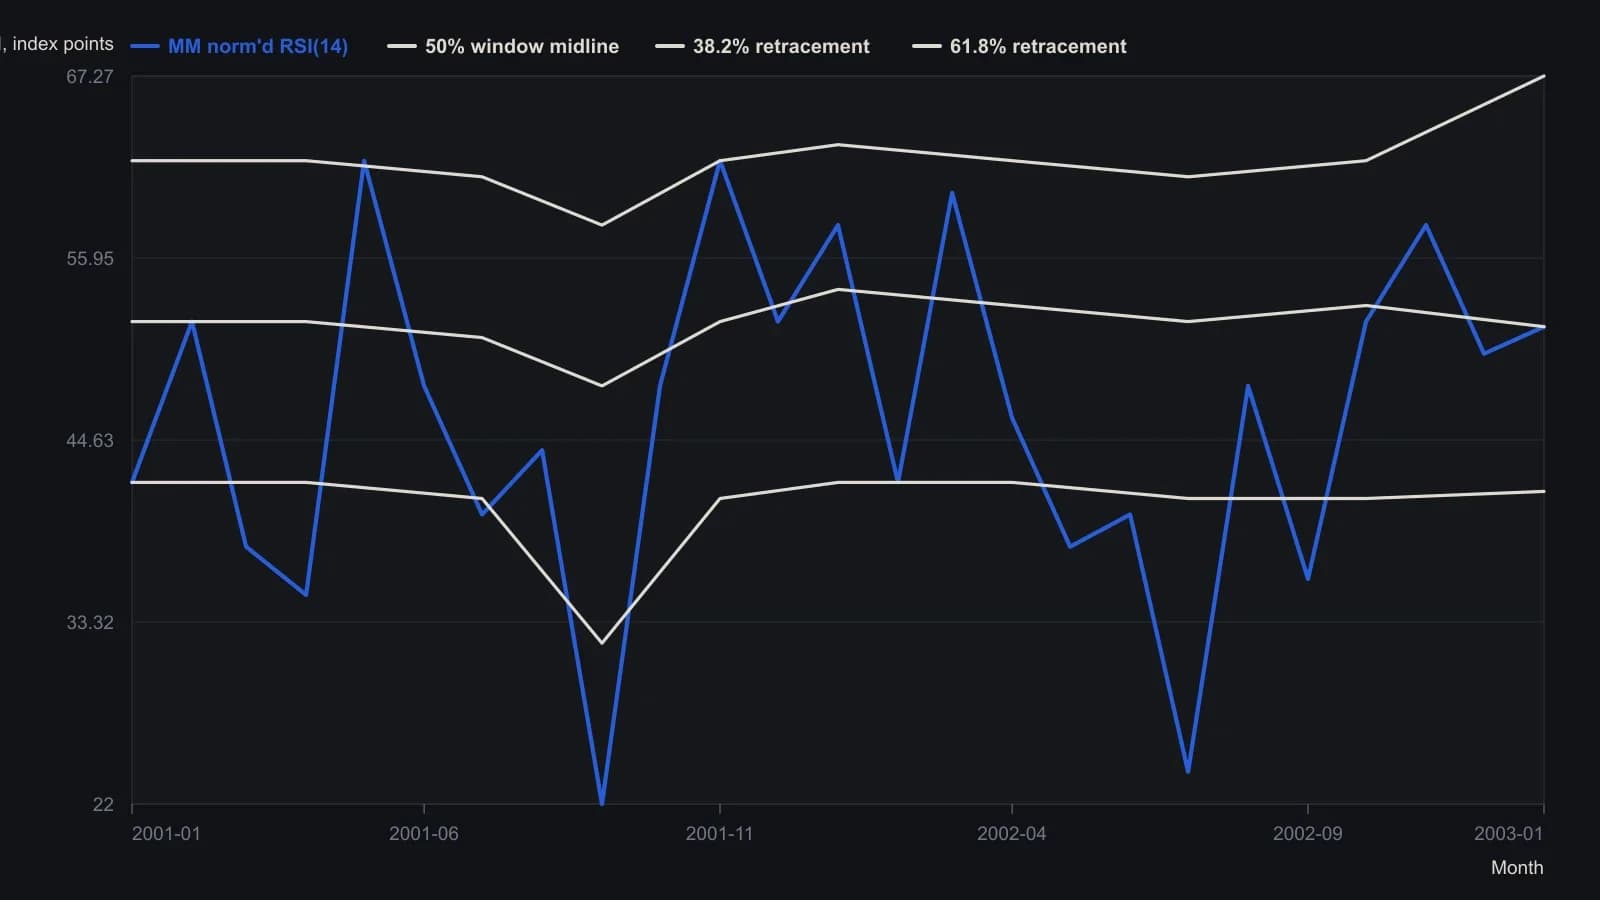
TradeStation EasyLanguage uses LookbackLength 400 and RSILength 14. Retracement traces are jagged because the window high and low update whenever a new RSI extreme appears. Right-scale labels 67.27, 55.98, 51.68, 41.44, 31.68, 27.81 and 15.62 are the live window levels on the last bar.
Fixed guides and stored coefficients
A second implementation can overlay fixed percentage guides on a 14-period RSI without first measuring a local high-low range.
Another implementation stores an observed RSI high and low as coefficients, then multiplies the range by each selected percentage to obtain the plotted levels.
All readings on this track · 17 readings
- 1996Testing Fibonacci retracement bins with moving-average swings
- 1996A pre-trade checklist for pullback entries and abstention
- 2003Sliding-window retracements on the relative strength index
- 2005Three removable gates for a long entry after a confirmed lower low
- 2005Why informal trend calling fails on a confused tape
- 2005Currency Fibonacci levels and overnight entry rules
- 2006Cycle and Fibonacci timing without trend context
- 2007Round-number reversals on equity-index charts
- 2008Parameter windows: exponential averages versus the alligator and Fibonacci lookbacks
- 2010A Dollar Index bounce as a failed-support, Fibonacci and volume test
- 2011A pre-trade checklist before Fibonacci entries
- 2012Fractal price growth and measured retracements
- 2015Scored reversals wait for a three-bar breakout
- 2016Intraday decision areas with Fibonacci and stochastic confirmation
- 2020One-to-one Fibonacci support on the February 2020 indexes
- 2020Fibonacci retracement levels fail a frequency test
- 2020A second-chance daytrade from the mean-reversion pivot zone