2010issue C1098-100
A Dollar Index bounce as a failed-support, Fibonacci and volume test
After a June 2010 swing high, the US Dollar Index declined to support near 80 from a February-March 2010 consolidation, then reversed higher over six sessions. This article treats that daily bounce as a classroom drill: stack a failed pullback support, an overhead Fibonacci resistance cluster, and volume on the reversal so the rally is graded as a testable hypothesis rather than accepted as a new trend.
- A failed pullback support on the decline was treated as a cue that price could continue toward the next significant support, which in this sequence was the February-March 2010 shelf near 80.
- After the bounce at 80.17, overhead work was mapped as one resistance cluster from 84.69 to 85.76, joining the 50 percent and 62 percent Fibonacci retracements with a former pullback support at 85.35.
- Volume-price analysis asked whether participation expanded on the reversal before treating the bounce as meaningful; volume at 80.17 was described as exceptionally strong.
- The open daily-chart question was whether the rebound was only a retracement inside a new downtrend or a reassertion of a bull phase that began in December 2009.
The bounce and the open question
After a June 2010 swing high, the US Dollar Index declined until support near 80, formed in a February-March 2010 consolidation, and then reversed higher over six sessions. The daily bounce was located at 80.17.
The daily-chart question posed in the archive was whether the rebound was only a retracement inside a new downtrend or a reassertion of a bull phase that began in December 2009.
US Dollar Index daily path into the August 2010 bounce
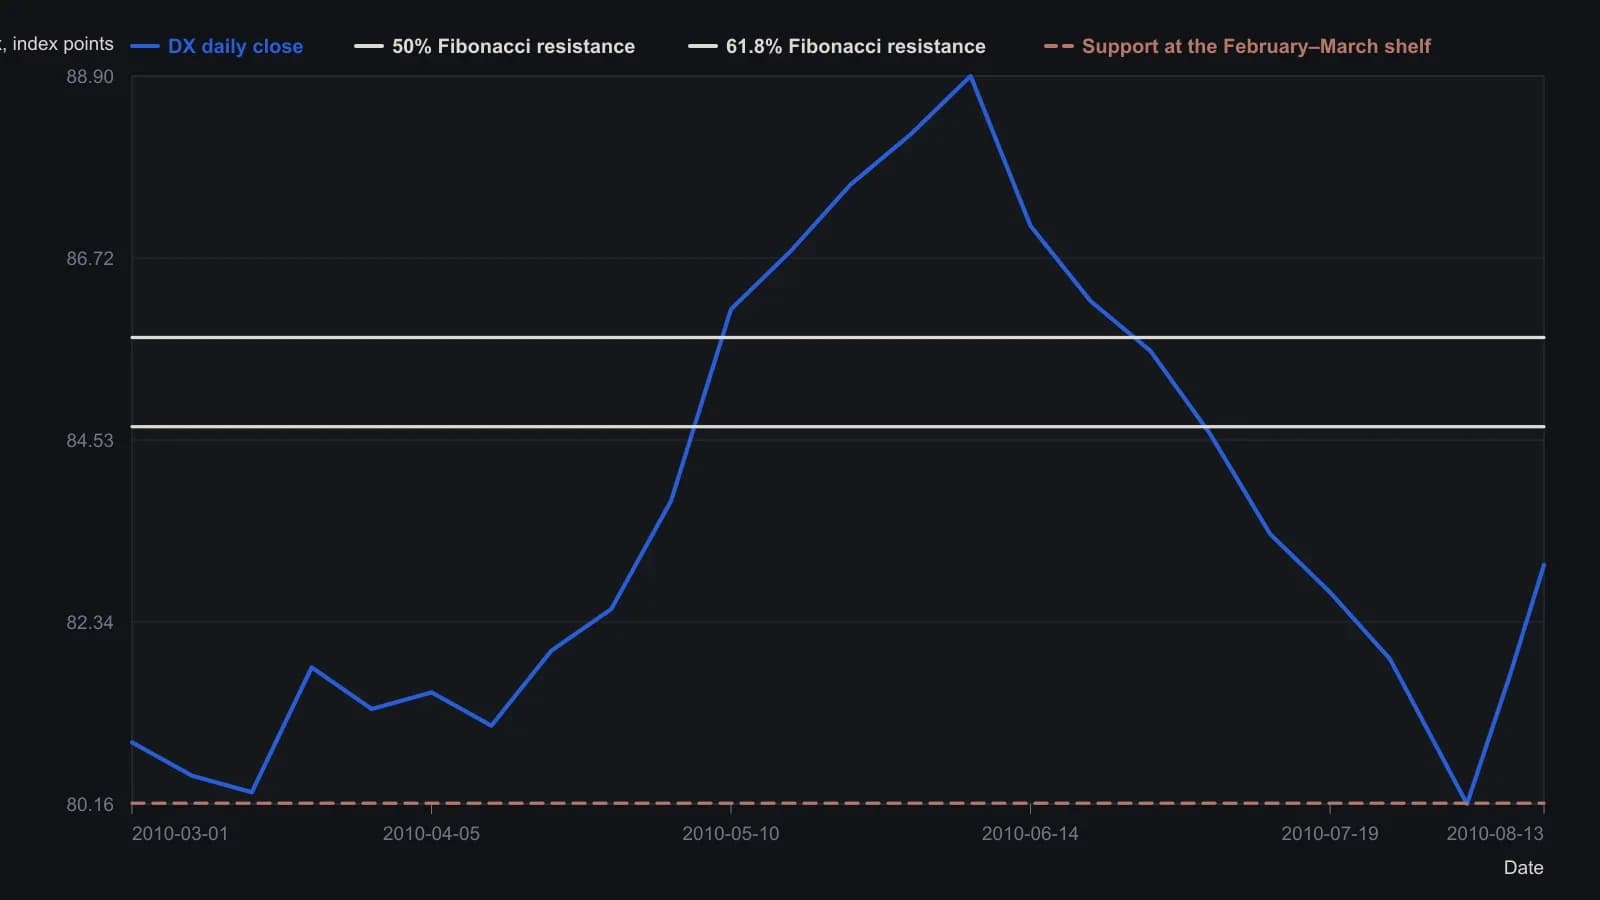
Daily closes digitized from the plotted candles at roughly weekly spacing, with extra samples at the June high, the August low, and the six-session reversal. Levels 80.158, 84.689 and 85.758 are the figure’s own Fibonacci labels, matching the text’s $80.17 / $84.69 / $85.76. Last printed session is 13 August 2010.
Failed pullback support as information
A labeled pullback support failed as the decline accelerated. That failure was treated as a cue that price could continue toward the next significant support. The index then reached support near 80, formed in the February-March 2010 consolidation.
Support and resistance, in this workflow, means prior swing and consolidation zones that attract reactions. A break or failure of a zone is read as information about the next likely test.
In May 2010 the index moved through resistance near 83.25 and continued higher. The archive presented that move as the inverse case of a support failure: a break of resistance using the same logic in the opposite direction.
Overhead resistance as a cluster
After the bounce, overhead resistance was mapped as a band from 84.69 to 85.76, matching the 50 percent and 62 percent Fibonacci retracements, with a former pullback support at 85.35 also overhead.
Fibonacci retracement here means percentage pullbacks of a prior swing, used to locate overhead resistance after a bounce from support. Pullback support is a support shelf formed on a pullback that, once violated, is re-read as potential resistance on a later rally.
Those nearby levels form a resistance cluster: a band of Fibonacci retracements plus a former pullback shelf, treated as one decision zone rather than a single line.
Volume and bar character at the reversal
Volume-price analysis checks whether participation expands on a reversal off a named level before treating the bounce as meaningful. At 80.17, volume on the reversal was described as exceptionally strong.
Wide-range bars classified as professional activity at major support were used as a reversal cue, while amateur bars were tied to failed breakouts at key support or resistance. That split is the professional-amateur-bars reading: wide-range activity near major support or resistance versus bars clustered around failed breakouts at those same zones.
How the stacked test is graded
Editorial reading: TradersWeek does not treat the six-session rebound as a new trend on its own. The failed pullback support, the exceptionally strong volume at 80.17, and the 84.69 to 85.76 resistance cluster are stacked so the bounce can be graded as a hypothesis.
The archive question, retracement inside a new downtrend versus reassertion of the bull phase that began in December 2009, remains the question the stack is meant to test. This article does not score either side.
All readings on this track · 17 readings
- 1996Testing Fibonacci retracement bins with moving-average swings
- 1996A pre-trade checklist for pullback entries and abstention
- 2003Sliding-window retracements on the relative strength index
- 2005Three removable gates for a long entry after a confirmed lower low
- 2005Why informal trend calling fails on a confused tape
- 2005Currency Fibonacci levels and overnight entry rules
- 2006Cycle and Fibonacci timing without trend context
- 2007Round-number reversals on equity-index charts
- 2008Parameter windows: exponential averages versus the alligator and Fibonacci lookbacks
- 2010A Dollar Index bounce as a failed-support, Fibonacci and volume test
- 2011A pre-trade checklist before Fibonacci entries
- 2012Fractal price growth and measured retracements
- 2015Scored reversals wait for a three-bar breakout
- 2016Intraday decision areas with Fibonacci and stochastic confirmation
- 2020One-to-one Fibonacci support on the February 2020 indexes
- 2020Fibonacci retracement levels fail a frequency test
- 2020A second-chance daytrade from the mean-reversion pivot zone