2007issue C091-2
Round-number reversals on equity-index charts
A historical case map of equity-index turning points shows how a psychologically obvious round-number-level becomes a support-resistance hypothesis that later price action can invalidate. Editorial reading: introduce a Fibonacci-retracement objective only after that number is left behind so the two methods remain independent tests.
- A round-number-level can be stated as a support-resistance hypothesis: price may stall or reverse there, and a later clear of that number invalidates the hypothesis.
- Psychological-equivalence treats round numbers that differ only in trailing zeros as comparable, and leading-digit-one levels were described as the strongest support or resistance.
- Editorial reading: introduce Fibonacci-retracement only after the round-number-level is left behind so the two methods remain independent tests.
- When major US indexes sat between large round numbers, the observed tendency was continuation toward the next such number.
A long map of turning points
A widely followed US industrial average reversed six times from the 100 area around the turn of the twentieth century. After clearing resistance near 100, that average later advanced through 200 and 300 and peaked near 400. During the 1929 decline, brief countertrend rallies stalled near 300 and 200, and the low formed near 40.
After later approaching 1000, the same average reversed into severe downtrends five times from that area.
Editorial reading: each interaction with a round-number-level can be stated as a support-resistance hypothesis. A later advance through 100, and later still through 1000, is the invalidation of that hypothesis, not a reason to keep the same level in force.
Same leading digit, different zeros
Round numbers that differ only in the number of trailing zeros were treated as psychologically equivalent, and those beginning with 1 were described as the strongest support or resistance.
Psychological-equivalence is the working assumption that those prints remain comparable even when they differ by orders of magnitude. A leading-digit-one print is the form described in the case material as the most persistent support or resistance among such levels.
Peaks and troughs from 1962 to 2007
On a 1962-2007 chart, nearly every peak or trough occurred while a popular index was hitting or nearing a large round number. Approaches to 1000 in 1966, 1968, 1973, 1976, and 1981 were each followed by a reversal, and the 1981 episode formed a bottom through three lows near 800 before resistance around 1000 finally gave way.
A second test after the number is left behind
In 1987 the industrial average passed through 2000 toward a Fibonacci objective near 2700 associated with the then-new index-futures market.
Editorial reading: Fibonacci-retracement is a measured objective taken from Fibonacci ratios applied to a prior swing. It should be introduced only after the round-number-level is left behind, so support-resistance at that number and the later Fibonacci-retracement remain independent tests of where the move may exhaust.
When the industrial average lost sensitivity
After the industrial average became less sensitive to round numbers, including 10000, later turning points aligned with other indexes: the NASDAQ Composite at 700 in early 1994, NASDAQ 2000 with the DAX at 6000 before the 1998 drop, NASDAQ 5000 with the DAX at 8000 at the 2000 peak, and the S&P 500 at 800 at the end of the 2001-02 decline.
When major US indexes sat between large round numbers, the observed tendency was continuation toward the next such number. At the same time the Shanghai Composite near 4000 and the DAX near 8000 were contemporaneous round-number tests.
Dow Jones Industrial Average, 1897–1983
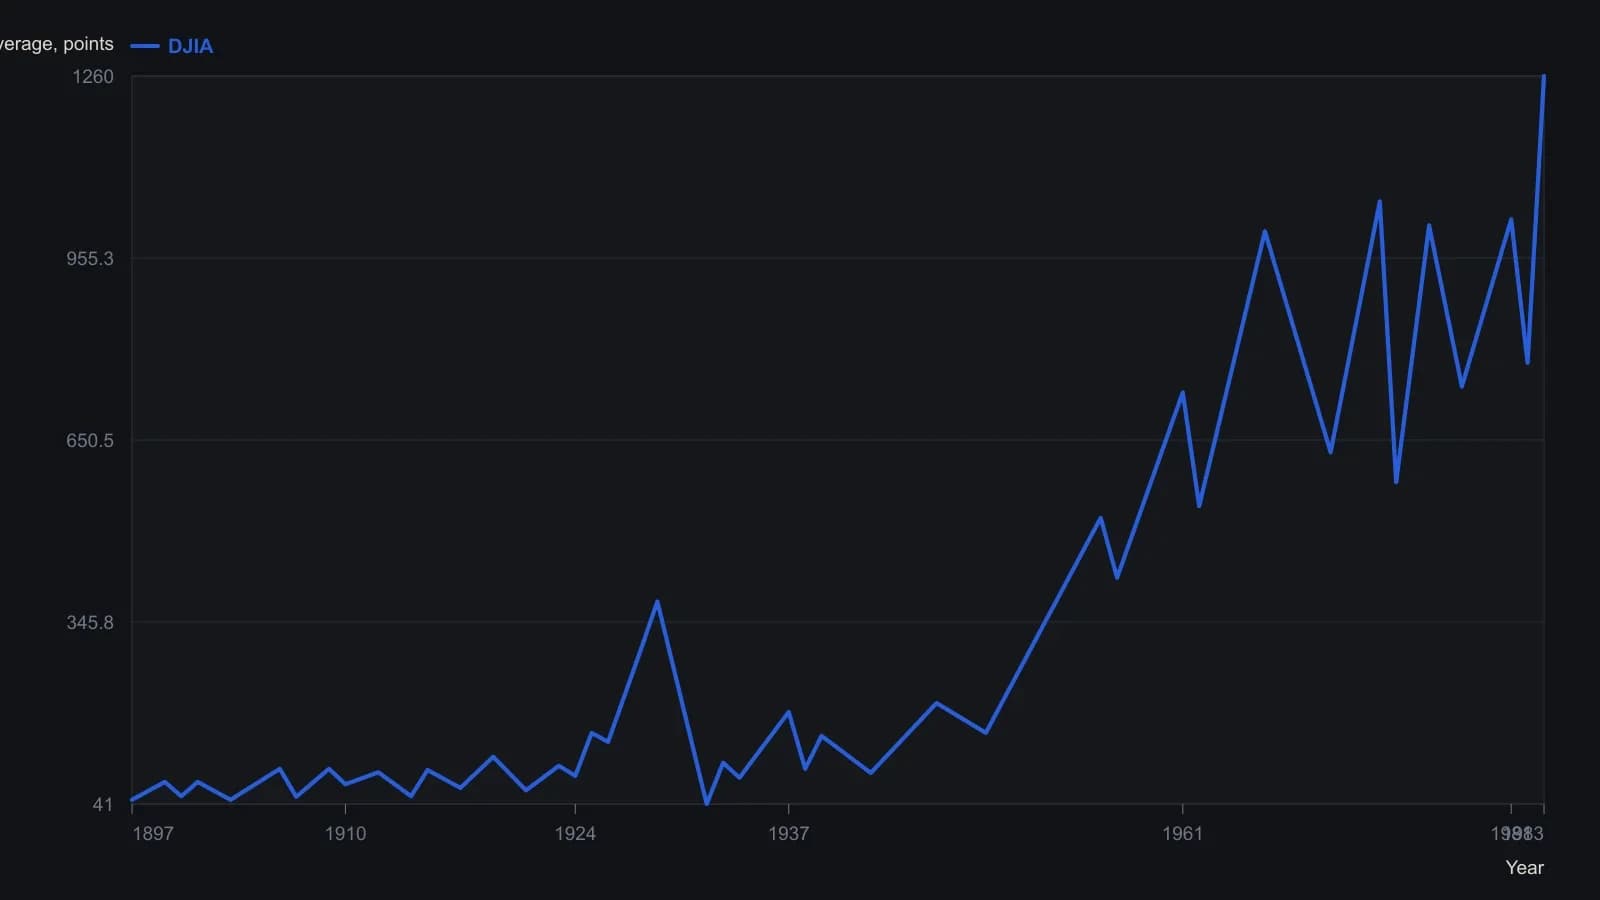
The source figure is logarithmic. Calendar years are placed from the 1897–1983 frame using the 1929 spike, the 1932 trough, and the 1974 break as landmarks. Levels are rounded to the precision the raster can support.
All readings on this track · 17 readings
- 1996Testing Fibonacci retracement bins with moving-average swings
- 1996A pre-trade checklist for pullback entries and abstention
- 2003Sliding-window retracements on the relative strength index
- 2005Three removable gates for a long entry after a confirmed lower low
- 2005Why informal trend calling fails on a confused tape
- 2005Currency Fibonacci levels and overnight entry rules
- 2006Cycle and Fibonacci timing without trend context
- 2007Round-number reversals on equity-index charts
- 2008Parameter windows: exponential averages versus the alligator and Fibonacci lookbacks
- 2010A Dollar Index bounce as a failed-support, Fibonacci and volume test
- 2011A pre-trade checklist before Fibonacci entries
- 2012Fractal price growth and measured retracements
- 2015Scored reversals wait for a three-bar breakout
- 2016Intraday decision areas with Fibonacci and stochastic confirmation
- 2020One-to-one Fibonacci support on the February 2020 indexes
- 2020Fibonacci retracement levels fail a frequency test
- 2020A second-chance daytrade from the mean-reversion pivot zone