2020issue C0646-48
Fibonacci retracement levels fail a frequency test
A common charting practice marks 38, 50, and 62 percent after a rise-retrace swing. A frequency-distribution-test of consecutive-valleys retrace-bottoms did not show isolated bunching at those cuts.
- Fibonacci-retracement is a percentage pullback of a prior swing height, commonly marked at 38, 50, and 62 percent as candidate stall zones.
- Those three cuts come from Fibonacci ratios that approach 1.618 and 0.618: dividing 0.618 by 1.618 yields about 38.2 percent, and dividing 1 by 1.618 yields about 61.8 percent.
- A frequency-distribution-test of retrace-bottoms formed a bell-shaped curve with no isolated spikes at 38, 50, or 62 percent for the 5-, 10-, and 20-day peak-valley-windows, and the 2-day chart also lacked distinct peaks at those values.
- On that evidence, expecting price to finish a retrace preferentially at 38, 50, or 62 percent was not supported.
The usual 38, 50, and 62 percent cuts
A common charting practice marks three retracement percentages, 38, 50, and 62, after a rise-retrace swing. Fibonacci-retracement is that percentage pullback of a prior swing height, and those three cuts are used as candidate stall zones.
Those cuts are obtained from Fibonacci ratios that approach 1.618 and 0.618. Dividing 0.618 by 1.618 yields about 38.2 percent, and dividing 1 by 1.618 yields about 61.8 percent.
On one illustrated swing from 1.86 to 4.00, a rise of 2.14, the 38 percent line was 3.19, the 50 percent line was 2.93, and the 62 percent line was 2.67. A later reading of that same swing treated the intervening valley, one cent above the 50 percent line, as the more relevant trigger than the 38 percent line used at the original entry.
A catalog of consecutive-valleys retraces
The frequency study used 489 stocks with daily data from 6 March 2009 through 12 February 2020, limited to that bull interval, and excluded any name whose close was at or below 5 at the start of the rise.
Candidate peaks and valleys had to stand out from neighboring bars over peak-valley-windows of 2, 5, 10, and 20 days on each side. A valid retrace required the later valley to fall between the first valley and the peak, after the peak in time, and the two valleys to be consecutive-valleys. That later valley is the retrace-bottom.
The 5-day window produced 35,905 samples, the 10-day window 18,939, the 20-day window 10,075, and the 2-day search was stopped near 65,000 samples.
No isolated spikes at the advertised cuts
The frequency-distribution-test is a bin count of where those retrace-bottoms land, used to look for clustering at the advertised percentages. Frequency bins formed a bell-shaped curve with no isolated spikes at 38, 50, or 62 percent for the 5-, 10-, and 20-day windows, and the 2-day chart also lacked distinct peaks at those values.
On that evidence, expecting price to finish a retrace preferentially at 38, 50, or 62 percent was not supported.
Retrace-bottom frequency by percentage bin
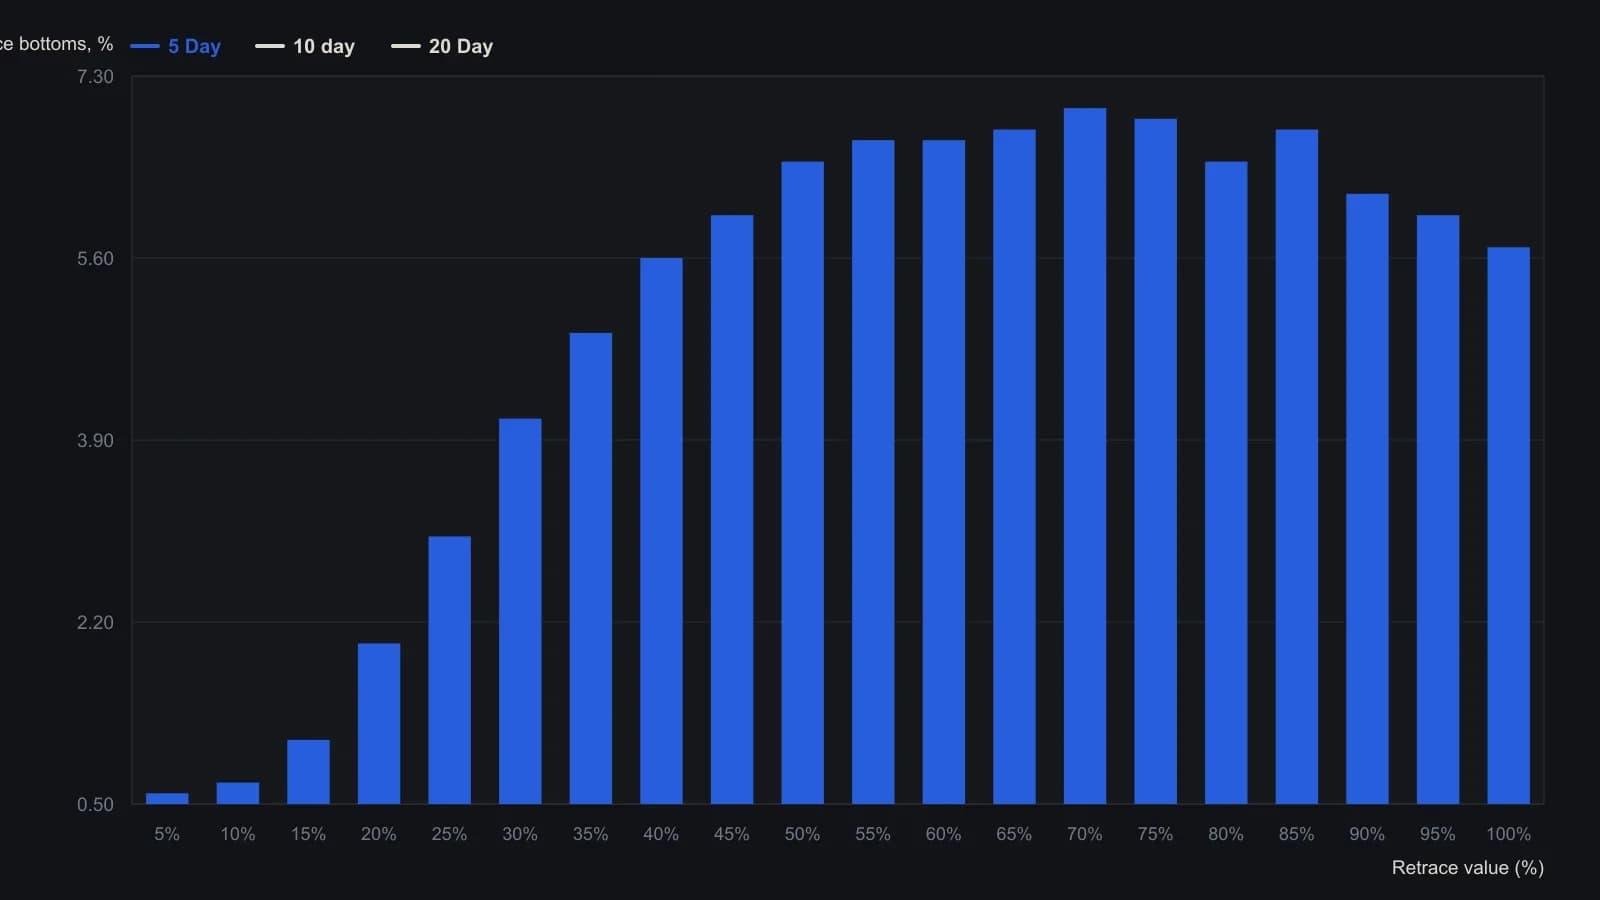
Bulkowski used 489 stocks, bull markets only from 6 Mar 2009 to 12 Feb 2020, excluding names at or below $5 at the start of the rise. Windows of 5, 10, and 20 days gave 35,905, 18,939, and 10,075 consecutive-valley samples. Axis labels mark the upper edge of each 5-point bin (5% = 0–5%). Digitized from the published bars; nearest 0.1 percentage point.
All readings on this track · 17 readings
- 1996Testing Fibonacci retracement bins with moving-average swings
- 1996A pre-trade checklist for pullback entries and abstention
- 2003Sliding-window retracements on the relative strength index
- 2005Three removable gates for a long entry after a confirmed lower low
- 2005Why informal trend calling fails on a confused tape
- 2005Currency Fibonacci levels and overnight entry rules
- 2006Cycle and Fibonacci timing without trend context
- 2007Round-number reversals on equity-index charts
- 2008Parameter windows: exponential averages versus the alligator and Fibonacci lookbacks
- 2010A Dollar Index bounce as a failed-support, Fibonacci and volume test
- 2011A pre-trade checklist before Fibonacci entries
- 2012Fractal price growth and measured retracements
- 2015Scored reversals wait for a three-bar breakout
- 2016Intraday decision areas with Fibonacci and stochastic confirmation
- 2020One-to-one Fibonacci support on the February 2020 indexes
- 2020Fibonacci retracement levels fail a frequency test
- 2020A second-chance daytrade from the mean-reversion pivot zone