1996issue C111-4
Normalize price and volume onto a common scale
A traditional construction maps each observation onto a standard normal curve around its own series mean. When volume is not treated as normal, a symbol-level alternative sets mean volume to 100, and price changes are divided by a first-open base so names at different levels can share one scale.
- Z-score-normalization maps a raw observation onto a standard normal curve so it can be described as average or as a stated number of standard-deviation units from its own series mean.
- The worked sample has a skewed-volume-distribution: on a scale that sets mean volume to 100, about 63 percent of daily volumes sit below the mean because a long right tail lifts the average.
- Relative-volume divides each day's volume by that symbol's mean and restates it on a mean-100 scale, so nearly identical raw prints of 433 and 434 became 46.146 and 61.733 against different symbol-level baselines.
- Relative-price-change divides an absolute move by the symbol's first opening price, and that base is reset after a split or consolidation so each segment uses its own first-open reference.
Map each observation onto its own series
A traditional construction maps raw values onto a standard normal curve so an observation can be described as average or as a stated number of standard-deviation units away from its own series mean.
That mapping is z-score-normalization: an observation is rescaled by its distance from a series mean, counted in standard-deviation units, so unlike series can be compared on one axis.
Use relative volume when the histogram is skewed
Volume in the worked sample is not bell-shaped. On a scale that sets mean volume to 100, about 63 percent of daily volumes sit below the mean because a long right tail lifts the average. That pattern is a skewed-volume-distribution: the mean sits above the typical day because a long right tail of unusually large sessions pulls the average higher.
When a series is not treated as normal, an alternative construction sets each symbol's mean volume to 100 and reports each day as relative-volume: that day's volume divided by the symbol mean, times 100, over the sampled interval.
Two sessions with nearly identical raw volume, 433 and 434, produced different relative volumes of 46.146 and 61.733 after each was divided by its own symbol mean.
Most sampled days print below average volume
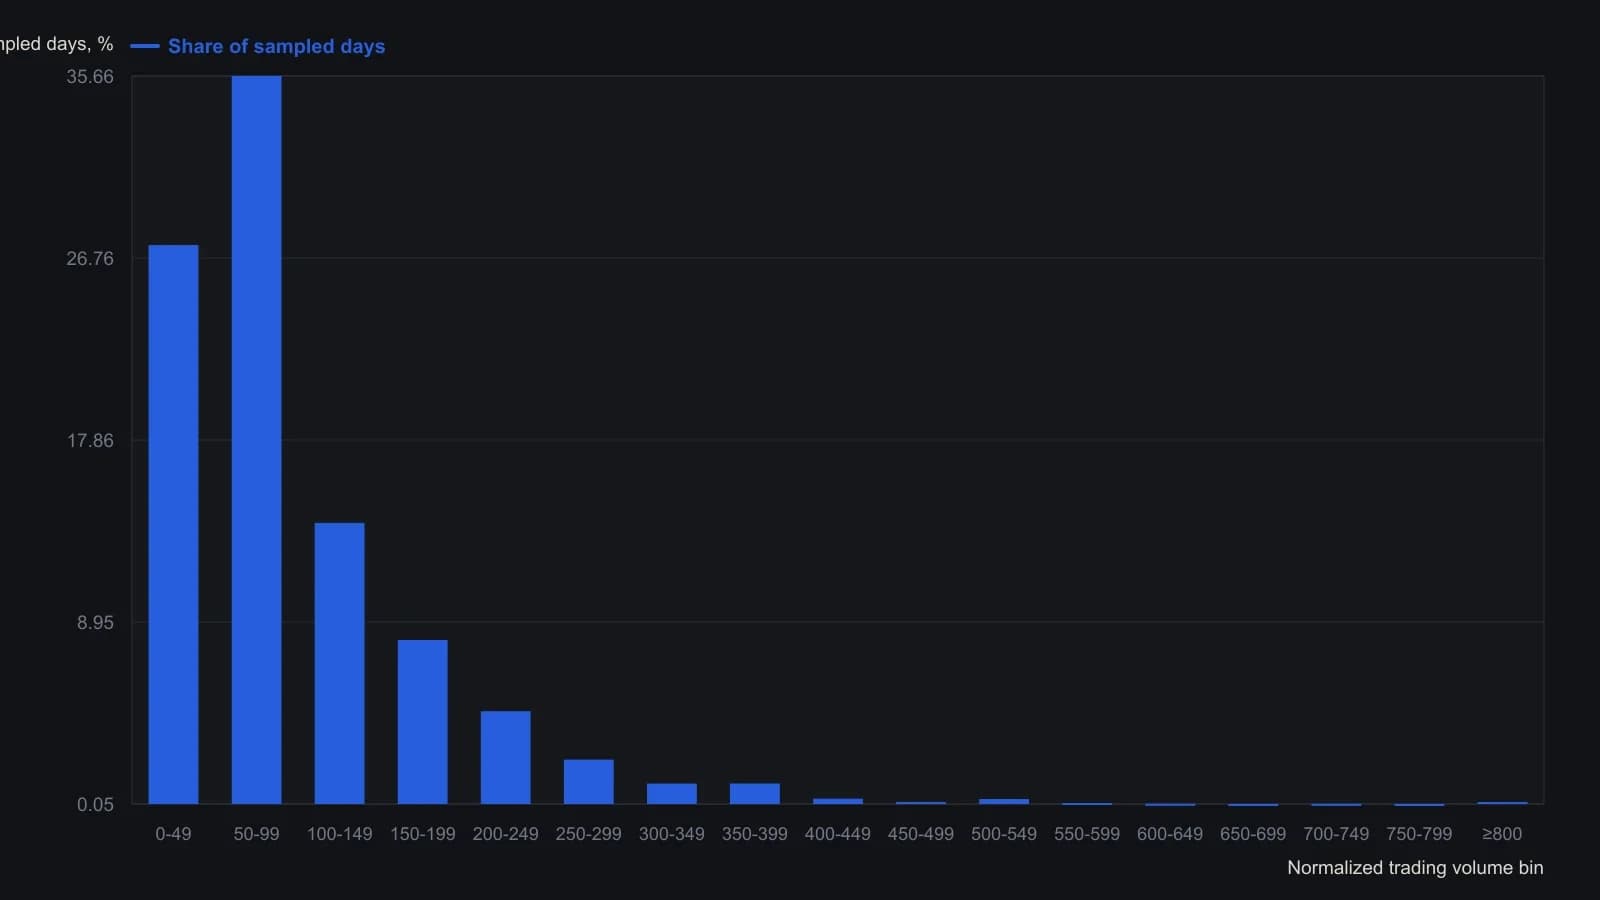
Average volume is indexed to 100. The source draws the same percentages on a log scale and notes one day above 1,600.
Join a symbol-level baseline to every row
Symbol-level mean volumes can be built by averaging volume grouped by symbol, stored as a lookup table, and written back onto each row by matching the current symbol.
A symbol-level-baseline is a single average or first-print reference computed per ticker and joined back to every row of that ticker.
Scale price change to a first-open base
A fixed dollar price change is treated as incomparable across price levels, so the absolute change is converted to relative-price-change by dividing it by that symbol's first opening price in the sample. The chosen base is typically the first opening price of the symbol or of a split-defined segment.
After a split or consolidation, the price-change base is reset so the pre-event and post-event segments each use their own first-open reference.
The first-open base can be carried down a symbol-sorted table by taking the current open when the symbol changes and otherwise reusing the previous row's base.
All readings on this track · 11 readings
- 1991Constructing standardized sentiment trend filters
- 1995Market z-score residuals for style pair construction
- 1995Constructing scaled z-score normalization for model inputs
- 1996Normalize price and volume onto a common scale
- 2001Constructing pair spreads with z-score triggers
- 2003Rebuilding band distance as a z-score crossover
- 2003Constructing price z-scores with dual averages and bands
- 2003Zigzag target zones from a normalized deviation oscillator
- 2005Constructing a z-score scored range-breakout filter
- 2006Constructing a trend system from Bollinger Bands and z-scores
- 2011How an adjustable-bands z-test resizes the no-trade zone