1991issue C081-3
Constructing standardized sentiment trend filters
Weekly consensus-poll readings were first converted into z-score units, then passed through stacked moving-median windows and a Hanning-weighted average. The finished line was read as a direction-based trend filter and was meant to sit beside other timing measures.
- Daily advisor-bullishness was treated as too volatile, so the workflow starts from weekly consensus-poll observations plus a smoother.
- Z-score normalization comes first: subtract the full-series mean and divide by the series standard deviation so more than one series can share a common scale.
- The trend is then defined by moving-median passes of widths 4, 2, 5, and 3, followed by a weighted moving average that uses Hanning weights.
- Reversals in the finished line marked a change in implied stance, and the construction was intended to be combined with other timing measures rather than used alone.
Compact the poll before filtering
Daily advisor-bullishness readings were treated as too volatile for a stable measure, so weekly observations plus a smoothing filter were used instead.
A consensus poll, in this construction, is a daily percentage of futures advisors who are bullish at that moment. Those daily percentages were later compacted to weekly observations before any filter was applied.
Rescale the series first
Z-score normalization subtracted the full-series mean from each observation and divided by the series standard deviation so more than one series could share a common scale. That full-series rescale is what puts several series on one axis before any trend is drawn.
Editorial: sharing one axis is the reason to normalize first. Sentiment and price can then be compared in the same units.
Apply the median passes, then the Hanning average
After that rescale, a trend filter of successive moving-median windows with widths 4, 2, 5, and 3 was applied. A trend filter here is a multi-pass smoother that reduces short-lived swings in an ordered series so later direction changes can be read as the working trend.
Each moving-median pass is a successive median window applied before the weighted average. The documented widths are 4, then 2, then 5, then 3.
The median-smoothed series was then passed through a weighted moving average that used Hanning weights. A weighted moving average assigns unequal weights to observations; the final pass uses those Hanning weights to finish the smoothed series.
Read reversals as the filter output
On the finished standardized series, readings above 1.0 and below -1.0 were treated as the major turning-point regions in the illustrated sample.
The constructed series was read as a direction-based trend filter. A reversal in the transformed line marked a change in implied stance.
The construction was intended to be combined with other timing measures rather than used alone.
The illustrated overlay
The illustrated overlay compared the transformed consensus series with a broad equity cash index from October 1987 through 19 April 1991.
Standardized S&P 500 close and transformed Market Vane
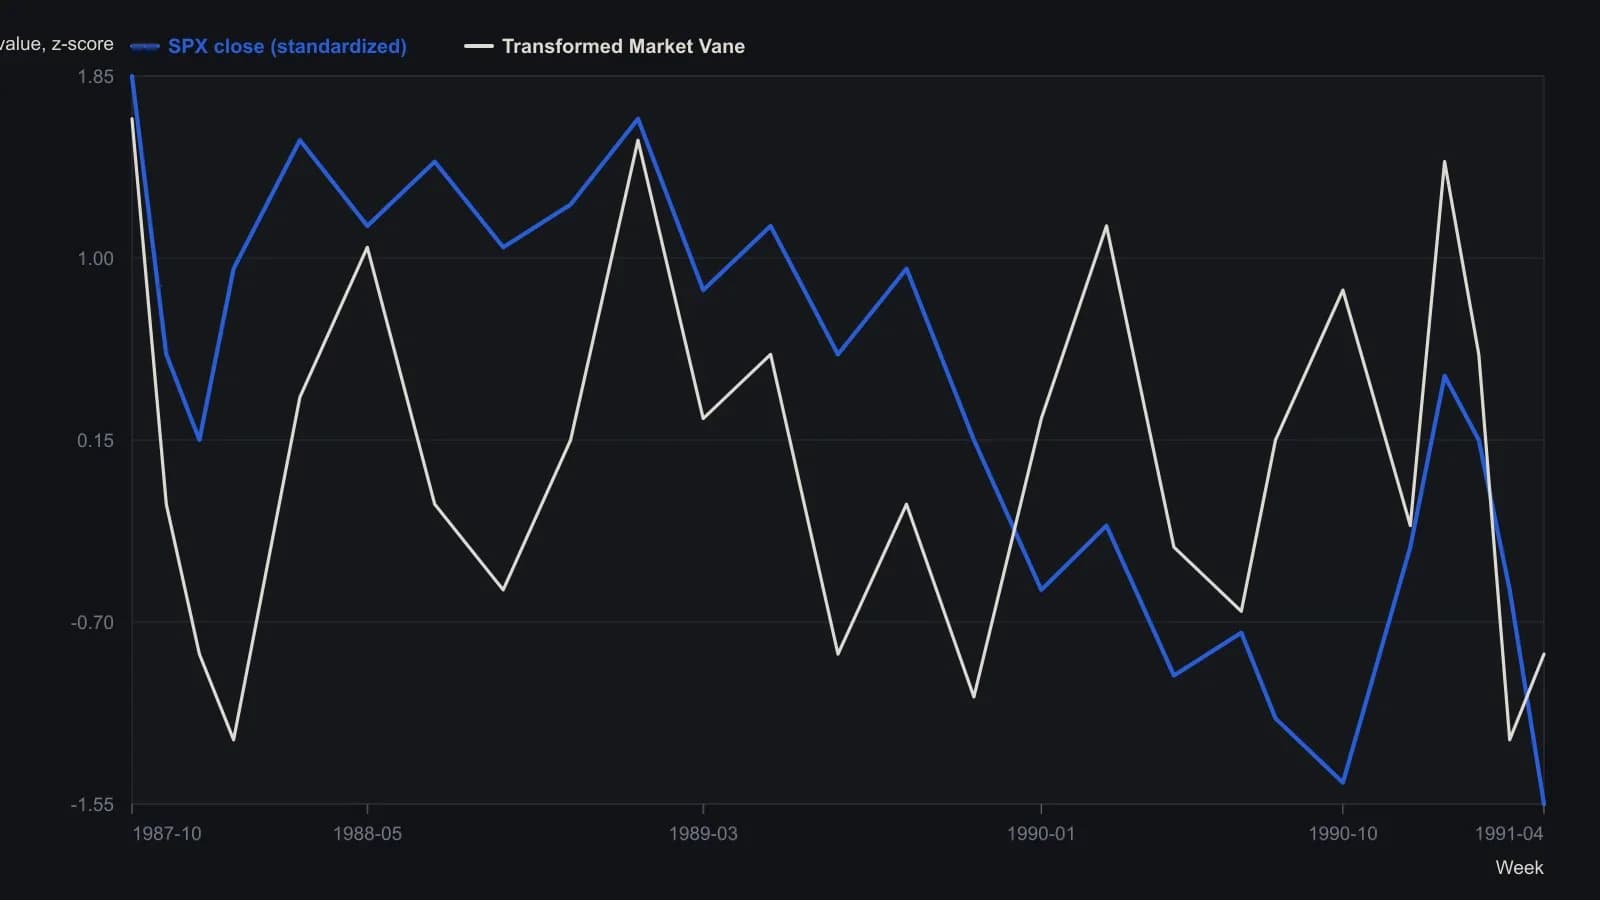
Source first converted weekly Market Vane bullishness to z-scores, then applied stacked moving medians with windows 4, 2, 5 and 3 and a Hanning-weighted average. Reported R² versus the S&P 500 rose from 0.09645 to 0.1284 after that filter. Digitized from the printed overlay; weekly ticks were sampled coarsely, so turning-point levels are approximate.
All readings on this track · 11 readings
- 1991Constructing standardized sentiment trend filters
- 1995Market z-score residuals for style pair construction
- 1995Constructing scaled z-score normalization for model inputs
- 1996Normalize price and volume onto a common scale
- 2001Constructing pair spreads with z-score triggers
- 2003Rebuilding band distance as a z-score crossover
- 2003Constructing price z-scores with dual averages and bands
- 2003Zigzag target zones from a normalized deviation oscillator
- 2005Constructing a z-score scored range-breakout filter
- 2006Constructing a trend system from Bollinger Bands and z-scores
- 2011How an adjustable-bands z-test resizes the no-trade zone