1995issue C041-7
Market z-score residuals for style pair construction
A historical workflow restated a stock and the S&P 500 as z-scores, subtracted the index, and rebuilt a residual-price-path. Linear-regression then compared original prices, residual prices, and the market index for high book-to-price AHM and low book-to-price KO.
- Closing prices of a stock and of the S&P 500 were converted to z-scores so both series sat on one standard-deviation scale, treated as ranging from -4 to +4.
- A residual-price-path was formed by subtracting the S&P 500 z-score and then restoring the stock mean and standard deviation.
- AHM stayed close to its residual path while KO diverged, and the residual-versus-original contrast was offered as an indirect reading of systematic-risk versus unsystematic-risk.
- Editorial reading: size a book-to-price-pair from residual correlation-analysis after index-subtraction, not from the high versus low book-to-price labels themselves.
Editorial framing: a two-name sleeve
Editorial framing: teach a two-name sleeve as an index-residual construction problem. Put each holding and the market on one z-score scale, peel off the common factor with index-subtraction, rebuild the residual-price-path, and size the pair from residual correlation-analysis instead of from book-to-price style labels.
The archive itself recorded the z-score restatement, the rebuilt residual-price-path, and the linear-regression comparisons. Those steps are historical workflow, not a present-day recommendation.
Putting stock and index on one z-score scale
A z-score is a closing observation restated as distance from that series mean, in units of that series standard deviation. Closing prices of a stock and of the S&P 500 were converted to z-scores by subtracting each series mean and dividing by that series standard deviation, placing both on a shared standard-deviation scale.
On that z-score scale, values were treated as ranging from -4 to +4, which was used to justify subtracting an index score from a stock score.
Rebuilding the residual-price-path
A residual-price-path is a rebuilt stock series formed by subtracting the market z-score and then restoring the stock mean and standard deviation. Index-subtraction removes a shared market-factor layer so remaining variability can be compared across names.
The worked book-to-price-pair
The worked sample used closes from 2 January 1985 through 30 September 1993 for high book-to-price AHM, low book-to-price KO, and the S&P 500. A book-to-price-pair is a high versus low book-to-price pairing used as a value-style name and a growth-style name.
Original AHM and residual AHM paths stayed similar, which the comparison treated as little S&P 500 influence on that high book-to-price name. Original KO and residual KO paths diverged sharply, which the comparison treated as substantial S&P 500 influence on that low book-to-price name.
Linear-regression readings
Linear-regression is a fitted line relating an original series, a residual series, or the market index so slope, intercept, and correlation can be read together. Linear-regression of original AHM on residual AHM produced a correlation of 0.614. Regression of the S&P 500 on original AHM produced 0.247 and on residual AHM produced 0.614.
Linear-regression of original KO on residual KO produced a correlation of 0.183. Regression of the S&P 500 on original KO produced 0.933 and on residual KO produced 0.183. Correlation-analysis is a check of how tightly original prices, residual prices, and the market index still move together after the factor is removed.
Systematic-risk and unsystematic-risk
The residual-versus-original contrast was offered as an indirect reading of systematic-risk versus unsystematic-risk that diversification can reduce. Systematic-risk is the market-linked share of variability that a common index factor is meant to capture. Unsystematic-risk is the name-specific share of variability that diversification is meant to reduce.
KO close versus residual path after removing S&P 500
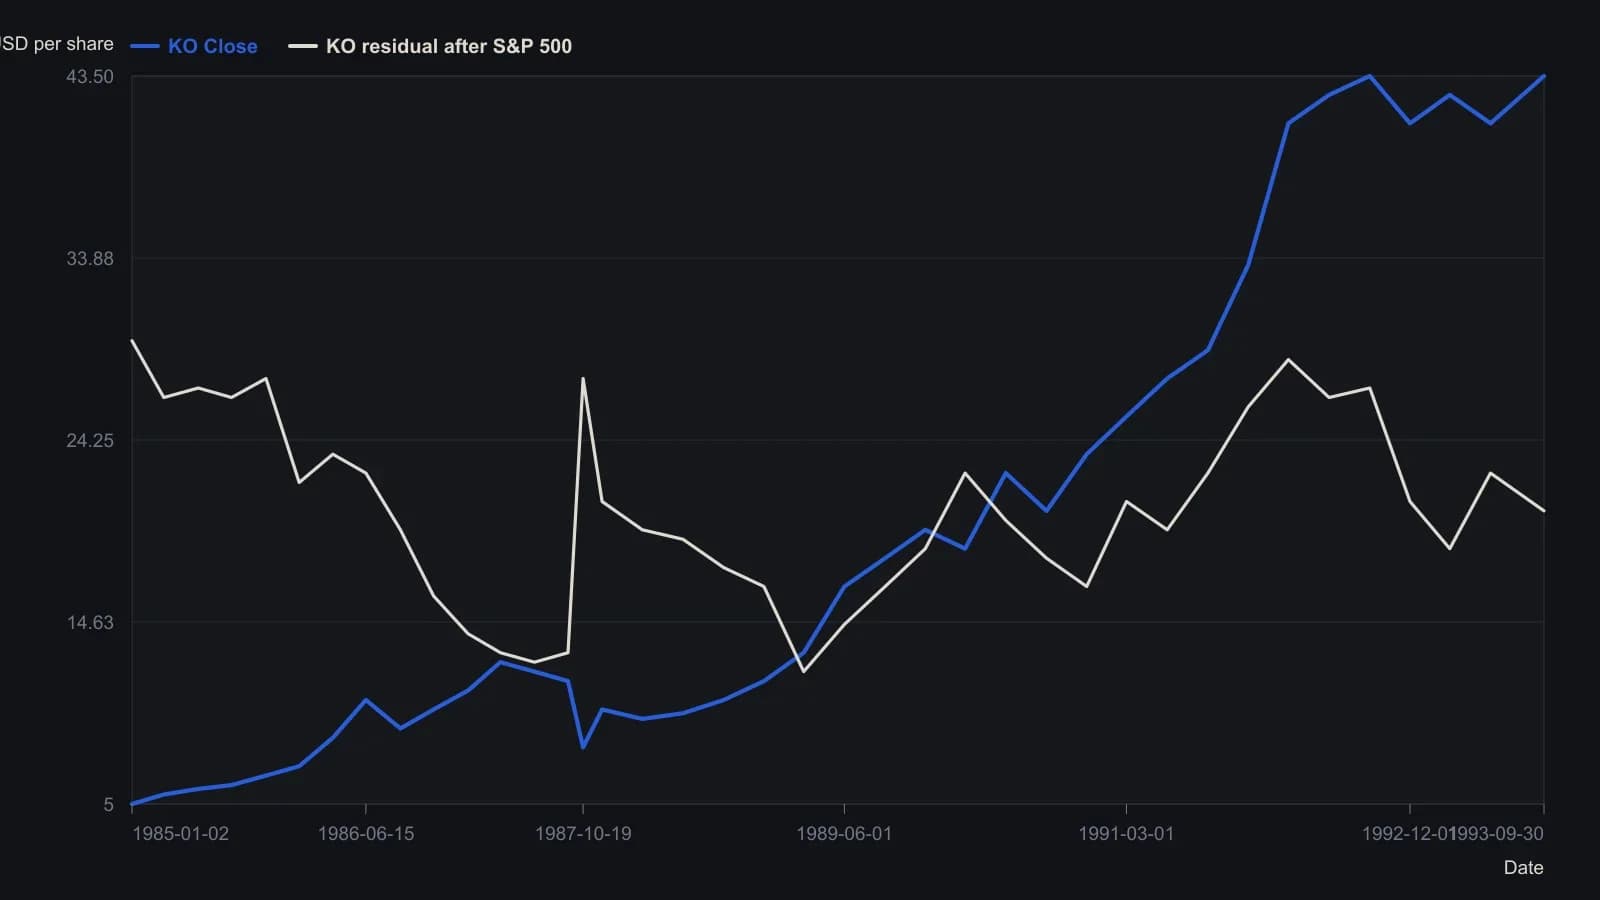
Daily closes 2 Jan 1985–30 Sep 1993. Residual series is (((SS KO − SS S&P) × SD KO) + mean KO). Digitised from the plotted curves; about 45 equally spaced samples, y rounded to 0.5 because the raster cannot support finer precision. Source regressions: KO vs residual r=0.183; S&P vs KO r=0.933.
All readings on this track · 11 readings
- 1991Constructing standardized sentiment trend filters
- 1995Market z-score residuals for style pair construction
- 1995Constructing scaled z-score normalization for model inputs
- 1996Normalize price and volume onto a common scale
- 2001Constructing pair spreads with z-score triggers
- 2003Rebuilding band distance as a z-score crossover
- 2003Constructing price z-scores with dual averages and bands
- 2003Zigzag target zones from a normalized deviation oscillator
- 2005Constructing a z-score scored range-breakout filter
- 2006Constructing a trend system from Bollinger Bands and z-scores
- 2011How an adjustable-bands z-test resizes the no-trade zone