1987issue C041-2
Evaluating weekly price cycles with autocorrelation cutoffs
Historical weekly-close work kept a cycle candidate only after price autocorrelation was positive and chi-square exceeded 3.84. A 22-week lag and a 23-week lag cleared that cutoff. Editorial reading then asks whether a 22-week dominant-cycle plus a 13-week seasonal grid organizes lengths already listed by independent studies.
- A weekly lag was kept only when price autocorrelation was positive and chi-square exceeded 3.84, the stated 95 percent chi-square-cutoff.
- A 22-week weekly-close-lag produced a chi-square of 12.61, and a 23-week lag in the same weekly-close series also cleared the 95 percent threshold.
- Most price and volume auto- and cross-correlations in that series were near random, with only a few highly significant chi-square values at scattered lags.
- A 22-week period was treated as a possible fundamental cycle, with harmonics placed on a 13-week seasonal grid next to independently listed lengths from 3 weeks through 234 weeks.
A two-gate reading of weekly cycle evaluation
Editorial framing presents the archive workflow as a two-gate test. A weekly-close-lag is kept only after an autocorrelation-test finds positive price dependence and the associated chi-square clears a predeclared chi-square-cutoff. The second gate asks whether one dominant-cycle, read with seasonal-analysis on a 13-week grid, can organize the same lengths that independent historical studies already listed.
An autocorrelation-test is a quantitative-model check on ordered price, volume, or breadth observations. It measures dependence at a chosen lag and compares that result with an explicit statistical baseline over a defined sampling interval and lookback. The weekly-close-lag is the spacing, in weeks, between paired closing observations used as a proxy for cyclic length.
The first gate is a chi-square-cutoff
Candidate weekly cycles were retained only when price autocorrelation was positive and the associated chi-square exceeded 3.84, the stated 95 percent cutoff. A 22-week price-to-price lag produced a chi-square of 12.61, well above that 3.84 cutoff. A 23-week lag in the same weekly-close autocorrelation also cleared the 95 percent threshold.
The same research series had found most price and volume auto- and cross-correlations near random, with only a few highly significant chi-square values at scattered lags.
The second gate uses a dominant-cycle and seasonal-analysis
A dominant-cycle step isolates a standout period from ordered market observations so a candidate length can be compared with a baseline and with other reported periods. A 22-week period was treated as a possible fundamental cycle whose harmonics sit near several of the independently listed lengths.
Seasonal-analysis is a portfolio-and-market-context lens that places a single period inside a weeks-to-months regime map. Here it asks whether one short cycle and its harmonics organize a broader grid of listed lengths. Possible cycle lengths were listed as multiples of 13 weeks and aligned against cycle lengths reported in earlier independent studies.
A consensus of the compared studies clustered near 234, 222, 212, 178, 156, 78, 65, 52, 39, 25-26, 12-13, 9-10, 6-7, and 3 weeks. Earlier cycle work had highlighted a 25-26 week period, whereas this weekly-close autocorrelation highlighted 22 and 23 weeks in that same band.
Editorial note: the archive records the cutoff, the two retained lags, and the comparison grid. It does not claim that 22 or 23 weeks replace the 25-26 week highlight. It only shows that both sit in the same band and that a 13-week seasonal grid can be used to organize the listed family of lengths.
Weekly cycle lengths on the 13-week seasonal grid
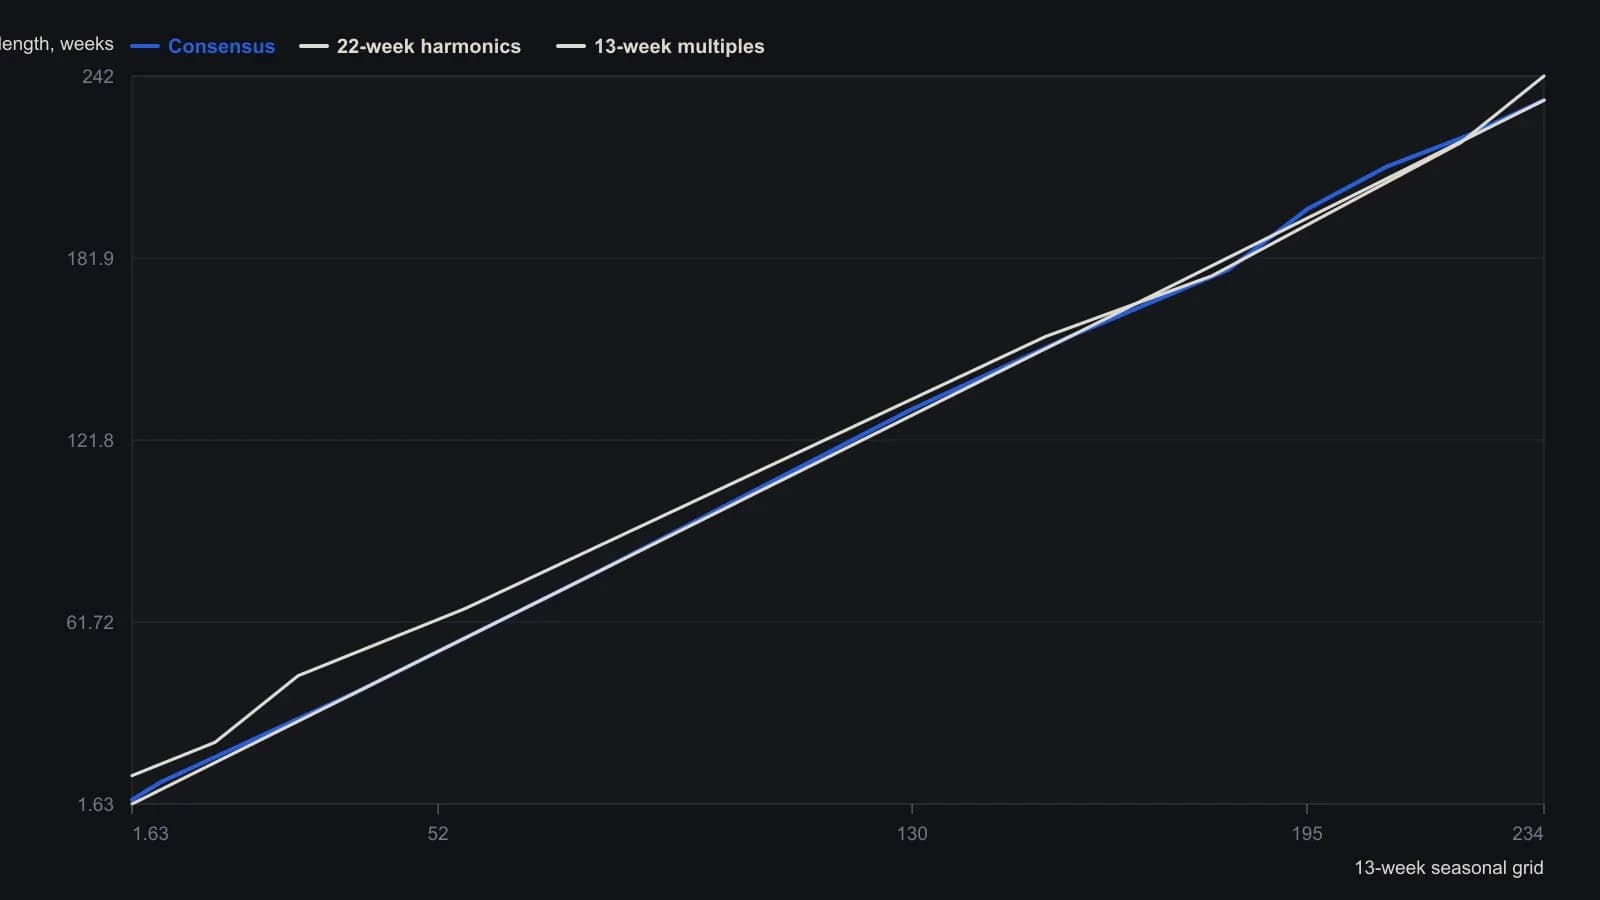
Tarkany kept a lag only when price autocorrelation was positive and chi-square exceeded the 95 percent cutoff of 3.84. He also reported a 22-week chi-square of 12.61. Paired Tarkany cells (234 and 237, 39 and 43, 22 and 23) are omitted rather than averaged.
All readings on this track · 15 readings
- 1987Evaluating weekly price cycles with autocorrelation cutoffs
- 1988Serial correlation is not an independence test
- 1988Event-triggered chi-square tests for jittered serial links
- 1988Reverse the rule before you trust the system
- 1990Chi-square evaluation of lagged breadth correlations
- 1990Two-gate out-of-sample tests for trading rules
- 1990Sign-cell correlation, chi-square checks, and lag shifts
- 1998Test serial dependence before you optimize a mechanical system
- 2003How a one-rank rotation is constructed for an offset autocorrelation check
- 2004Constructing first-order residual autocorrelation tests
- 2004A two-stage Durbin-Watson residual screen
- 2011Constructing trend labels from increment correlation atoms
- 2012Overnight versus daytime return evaluation
- 2012Constructing a multi-horizon folded-correlation reversal filter
- 2016Tuning indicators to measured market cycles