1990issue C041-2
Sign-cell correlation, chi-square checks, and lag shifts
A four-cell sign table turns two series of signed changes into correlation analysis and a chi-square test, then an autocorrelation test rebuilds the same table after each lagged shift.
- Two indicator series can be compared by converting each reading into a signed change and placing each contemporaneous pair into a four-cell sign table.
- Correlation analysis reads a coefficient from the four cell counts A, B, C, and D, or from same-sign tallies and different-sign tallies.
- A chi-square test multiplies the paired-observation count by the square of the correlation reading and compares the result with a fixed threshold.
- An autocorrelation test repeats the same four-cell construction after each lagged shift, pairing an earlier change in the first series with a later change in the second series.
A workshop construction
Editorial interpretation: the steps below are a workshop construction. Convert two ordered indicator series into a four-cell sign table, read association and a chi-square check from the same tallies, then rebuild the table after a lag so a lead-versus-coincident question can be tested before either series is treated as an independent input.
Build the four-cell sign table
Two indicator series can be compared by converting each reading into a signed change and placing each contemporaneous pair into one of four cells: both up, first down and second up, first up and second down, or both down.
That tally is a four-cell sign table: paired signed changes counted into both-up, mixed, and both-down compartments. Correlation analysis is the construction that turns those two series of signed changes into this table and a coefficient that reports how often the series move in the same direction.
Read correlation from the same tallies
A correlation coefficient can be computed from the four cell counts A, B, C, and D as the difference A times D minus B times C, divided by the product of the four marginal totals A plus B, C plus D, A plus C, and B plus D.
An approximation uses same-sign tallies SA equal to A plus D and different-sign tallies DI equal to B plus C. Approximate correlation equals SA minus DI over SA plus DI, and SA plus DI equals the paired-observation count N.
The approximate correlation expressed as a percentage equals the same-sign percentage minus the different-sign percentage.
Obtain a chi-square check
A chi-square statistic can be obtained by multiplying the paired-observation count N by the square of the correlation coefficient. The chi-square test is that check: multiply the paired-observation count by the square of the correlation reading and compare the result with a fixed threshold.
A worked comparison
In a worked comparison of two change series the cell counts were A 736, B 55, C 31, and D 465, giving an approximate correlation of 0.86 and a chi-square of 954 on 1287 pairs, a value larger than 3.84.
CPQ versus CADV four-cell sign tallies
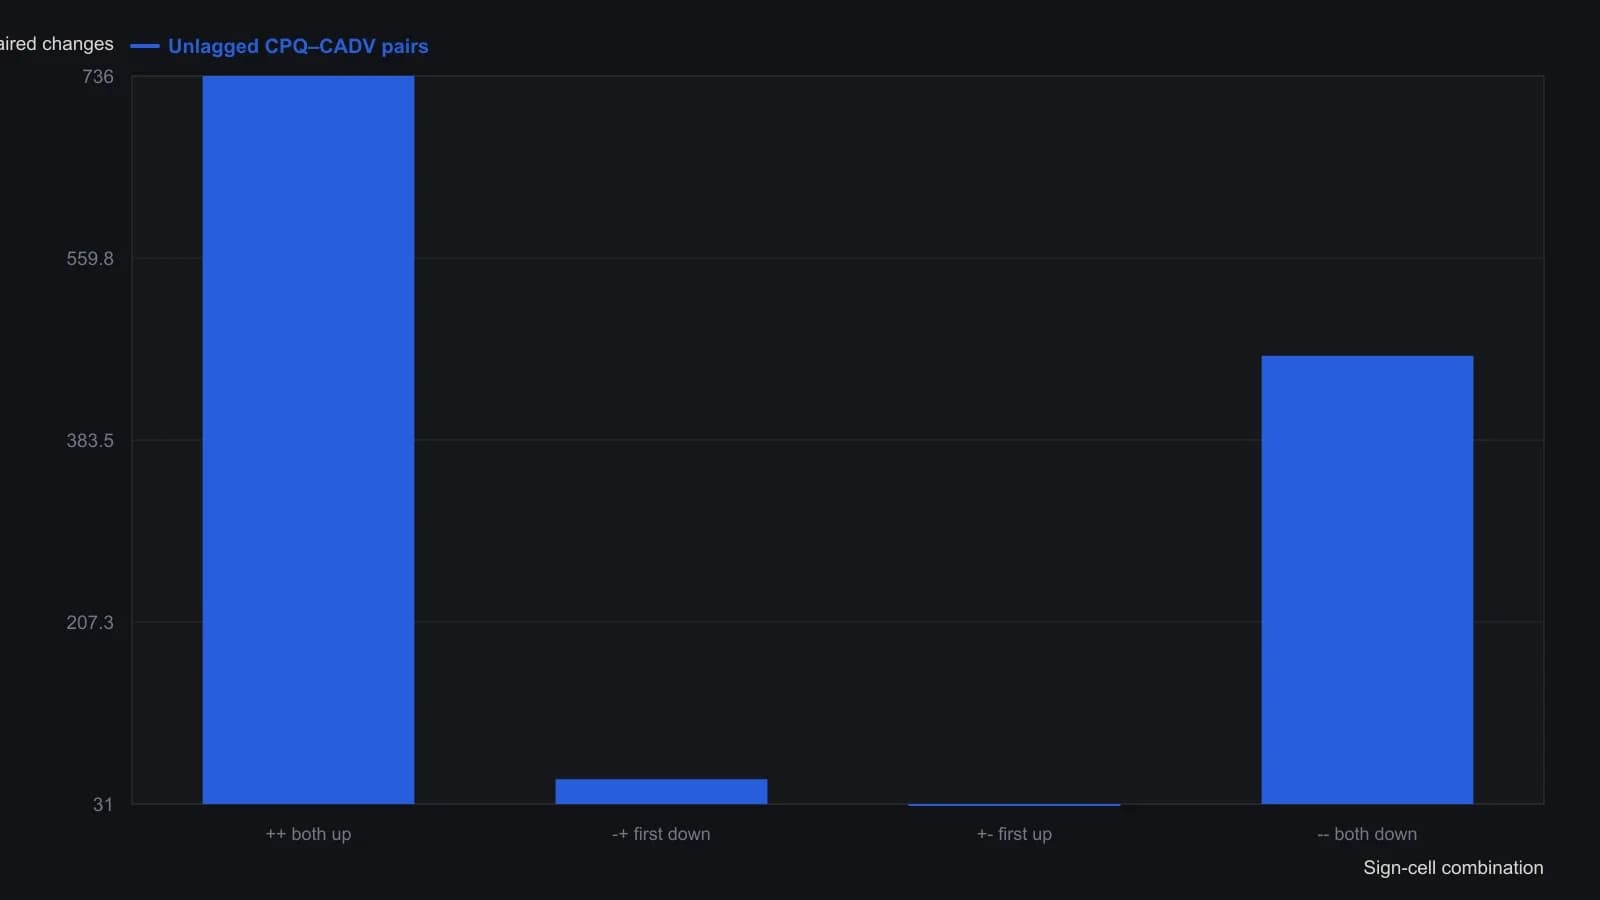
Zero-lag pairing only. The sidebar tells how to rebuild the four cells after each lag but does not publish those shifted tables.
Repeat the table after each lag
Lagged comparisons are formed by shifting the second series so an earlier change in the first series is paired with a later change in the second series, with a separate four-cell table kept for each lag. That offset is a lagged shift.
An autocorrelation test is a lagged reuse of the same four-cell construction: pair an earlier change in one series with a later change in the other and keep a separate table for each shift.
All readings on this track · 15 readings
- 1987Evaluating weekly price cycles with autocorrelation cutoffs
- 1988Serial correlation is not an independence test
- 1988Event-triggered chi-square tests for jittered serial links
- 1988Reverse the rule before you trust the system
- 1990Chi-square evaluation of lagged breadth correlations
- 1990Two-gate out-of-sample tests for trading rules
- 1990Sign-cell correlation, chi-square checks, and lag shifts
- 1998Test serial dependence before you optimize a mechanical system
- 2003How a one-rank rotation is constructed for an offset autocorrelation check
- 2004Constructing first-order residual autocorrelation tests
- 2004A two-stage Durbin-Watson residual screen
- 2011Constructing trend labels from increment correlation atoms
- 2012Overnight versus daytime return evaluation
- 2012Constructing a multi-horizon folded-correlation reversal filter
- 2016Tuning indicators to measured market cycles