2011issue C138-11
Constructing trend labels from increment correlation atoms
A three-print window is the smallest trend label: same-sign increments form a microtrend, mixed signs form a microcycle. Averaging those increment products is a lag-1 increment autocorrelation, and a moving average of the products is a second filter on the labels.
- A three-print price window is the smallest labeled unit: two successive rises or two successive falls form a microtrend, while mixed directions form a microcycle.
- The correlation atom is the product of consecutive first differences. Its sign labels a microtrend or a microcycle, and its magnitude is a rough intensity score.
- The lag-1 increment autocorrelation is the average of those atoms over a defined lookback. It lies between -1 and +1, with zero meaning no pairing on average.
- Runs of two or more consecutive positive atoms mark longer trends, and an atom moving average is used as a smoother trend and cycle filter that can withhold a series below a chosen threshold.
The smallest trend label
A three-print price window is the smallest unit labeled as a trend. Two successive rises or two successive falls form a microtrend, while mixed directions form a microcycle.
From increments to correlation atoms
From an ordered price series, the increment series is the first-difference sequence. The correlation atom is the product of two consecutive increments.
The product of consecutive first differences is positive for a microtrend and negative for a microcycle. The product magnitude is used as a rough intensity score for that three-print window. A positive atom marks a microtrend on that day, and a negative atom marks a microcycle.
Averaging the atoms
The lag-1 increment autocorrelation equals the average of the correlation atoms and lies between -1 and +1. The endpoints mean complete same-sign pairing versus complete opposite-sign pairing. Zero means no pairing on average.
A worksheet layout
The atom series can be built in a worksheet from an averaged-price column, a first-difference column, and a third column that multiplies consecutive differences.
WHI correlation atoms from the construction worksheet
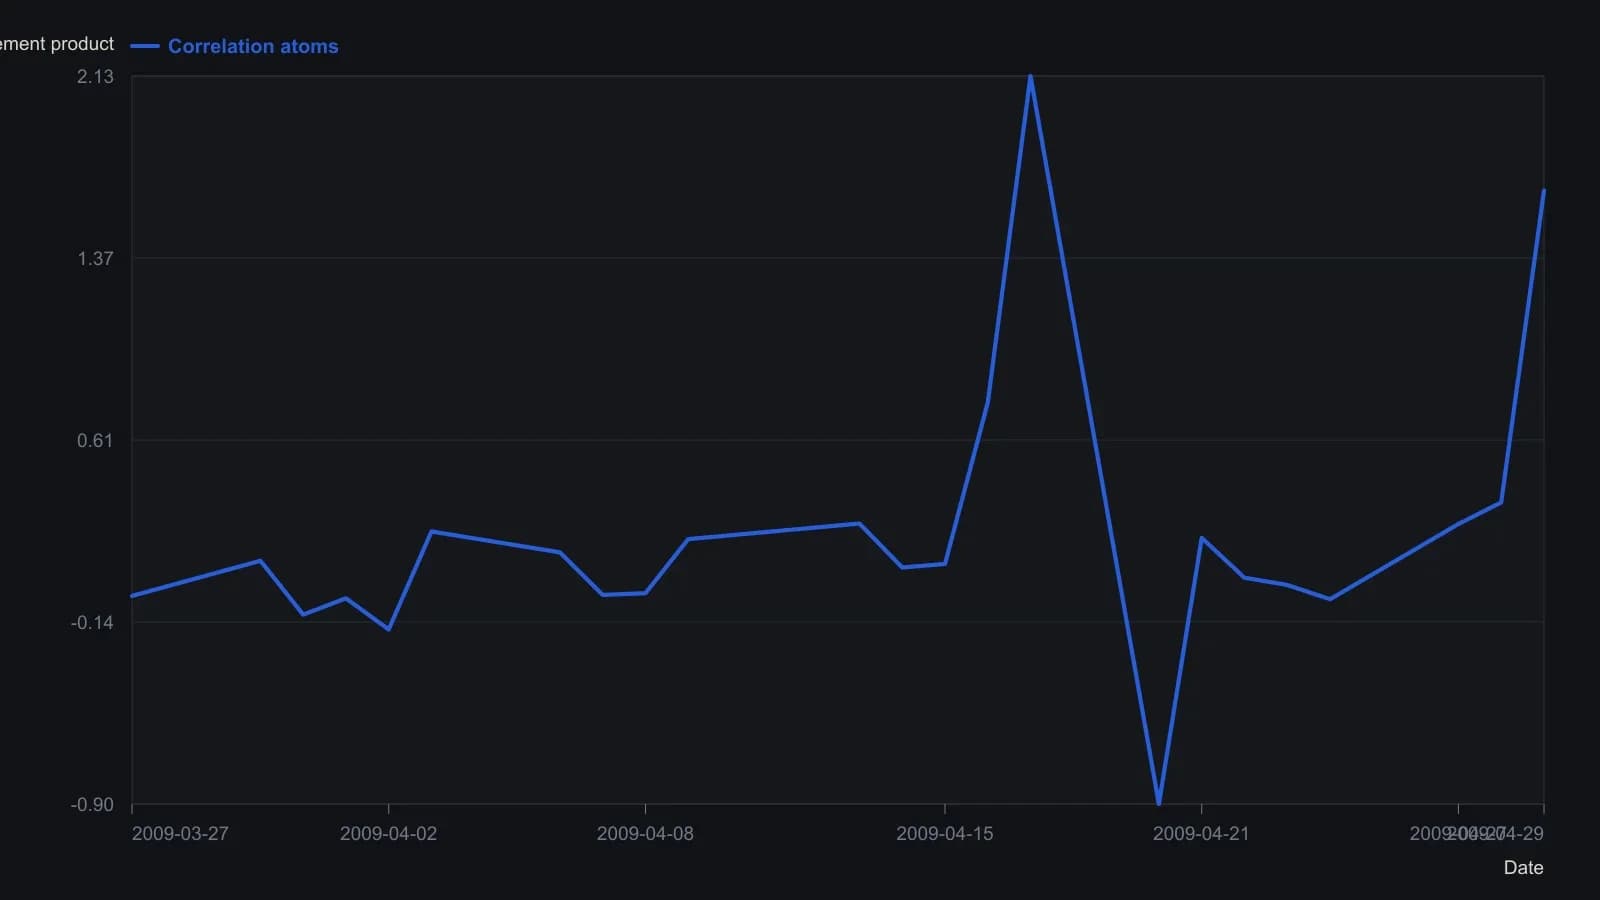
The sidebar shows only the first 25 of 252 daily records. Average price is the mean of open, high, low and close. An atom is defined only from the third print onward.
Longer trends and cycles
Runs of two or more consecutive positive atoms are used to mark longer trends. Longer cycles are read as stretches of positive atoms broken at regular intervals by one or more negative atoms.
A historical scan of increment autocorrelations illustrated one series whose atoms were more often positive over an average-price window. The construction reads that balance as more trending windows than cycling windows.
The atom moving average
A moving average of the atom series is used as a smoother trend and cycle filter. One construction applied a session-count average of increment atoms and withheld further use of the series when that average fell below a chosen threshold.
All readings on this track · 15 readings
- 1987Evaluating weekly price cycles with autocorrelation cutoffs
- 1988Serial correlation is not an independence test
- 1988Event-triggered chi-square tests for jittered serial links
- 1988Reverse the rule before you trust the system
- 1990Chi-square evaluation of lagged breadth correlations
- 1990Two-gate out-of-sample tests for trading rules
- 1990Sign-cell correlation, chi-square checks, and lag shifts
- 1998Test serial dependence before you optimize a mechanical system
- 2003How a one-rank rotation is constructed for an offset autocorrelation check
- 2004Constructing first-order residual autocorrelation tests
- 2004A two-stage Durbin-Watson residual screen
- 2011Constructing trend labels from increment correlation atoms
- 2012Overnight versus daytime return evaluation
- 2012Constructing a multi-horizon folded-correlation reversal filter
- 2016Tuning indicators to measured market cycles