2004issue C041-3
A two-stage Durbin-Watson residual screen
High pairwise correlation does not mean regression leftovers still travel together. This archive walkthrough builds a two-stage screen that isolates co-moving series first, then keeps only pairs whose linear-regression residuals still show first-order dependence.
- Price or return correlation can be high while residual autocorrelation after a linear fit remains low.
- Autocorrelation is constructed as the correlation of residuals from a linear regression on ordered market observations.
- The intended construction isolates highly correlated series first, then refines that set with a residual autocorrelation test.
- The Durbin-Watson statistic scores first-order residual dependence from 0 to 4, with 2 marking no serial correlation.
High correlation can leave independent leftovers
Price-series or return-series correlation between two names can be high while residual autocorrelation after a linear fit remains low. Correlation analysis is a cross-sectional measure of how closely two price or return series move together over a stated lookback. That ranking can still leave pairs whose linear-regression leftovers do not keep travelling together from one sampling interval to the next.
Build the residual series before you score it
Autocorrelation is constructed as the correlation of residuals from a regression applied to ordered market observations. Linear regression is a fitted line on those observations. Its leftovers become the input series for the serial-correlation statistic.
Construction inspects linear-regression residuals for residual runs before the serial-correlation score is applied. A residual run is a stretch of same-sign leftovers across adjacent sampling intervals, which is the pattern the test is built to score. An autocorrelation test is a first-order check of whether successive regression residuals are serially related rather than independent.
Stage one isolates co-moving series
The intended construction is a two-stage screen: isolate highly correlated series first, then refine that set with a residual autocorrelation test.
A 60-session Pearson correlation was applied to ten names that had first been filtered by 12-month price correlation to a reference series. That first stage is the correlation filter. It narrows the set to names that already move with a reference series, then with one another over the shorter 60-session window.
Stage two scores residual dependence
The same ten names were then scored with a 60-session Durbin-Watson statistic so residual dependence could be compared with the Pearson ranking. The Durbin-Watson statistic tests first-order residual dependence by pairing the leftover at time t with the leftover at t-1. It maps onto a 0-to-4 scale on which 2 indicates no serial correlation.
Daily closes for AMAT and three correlated peers
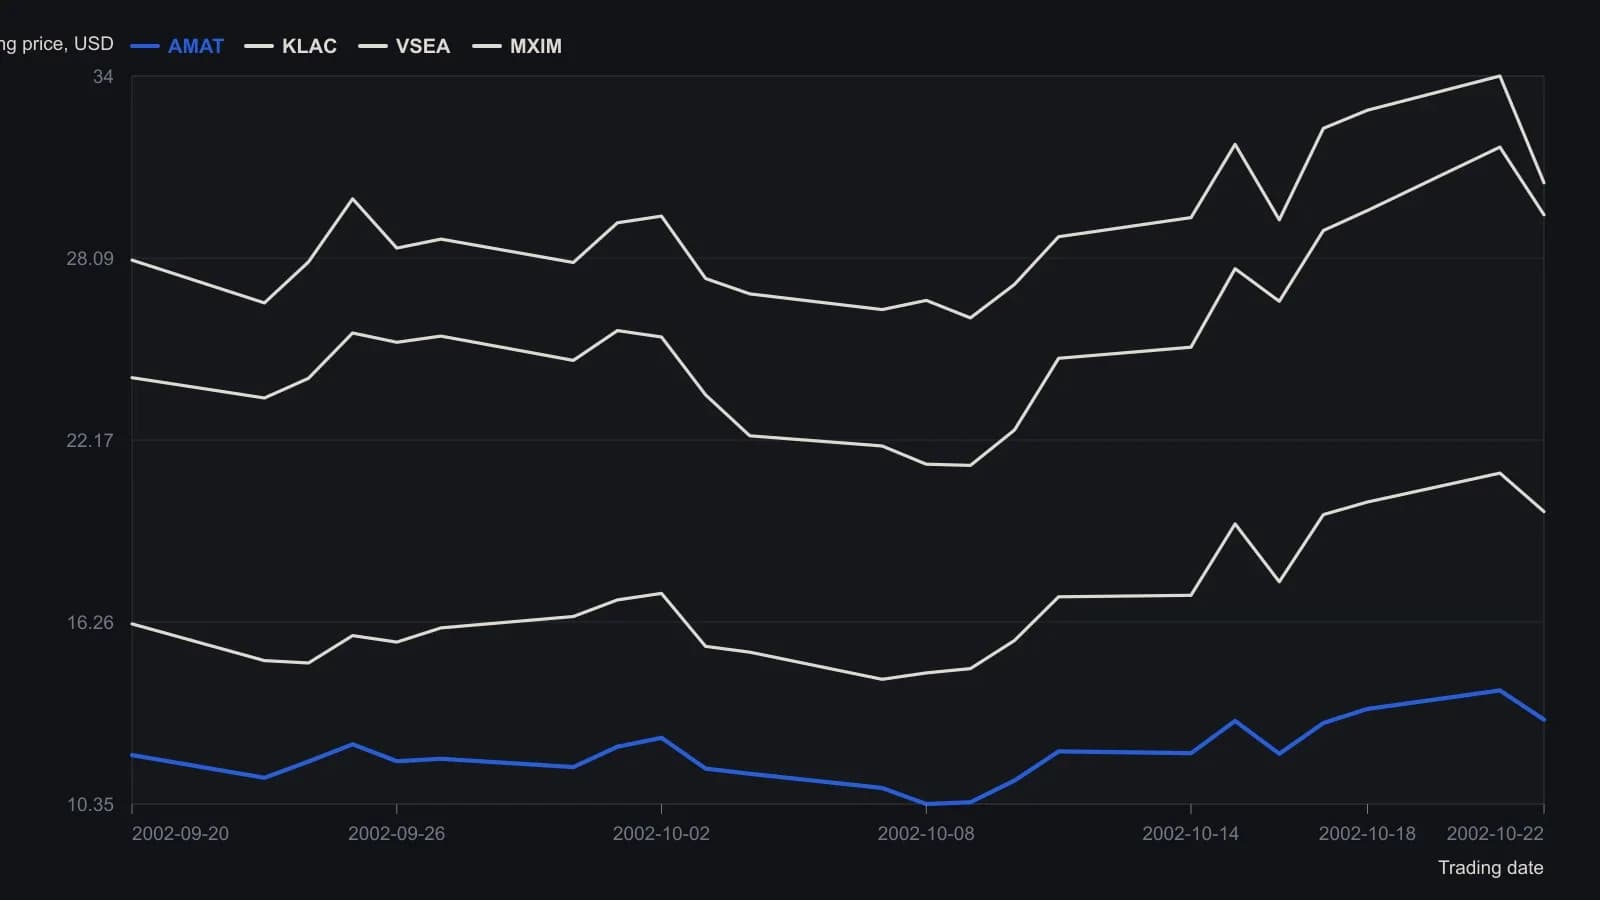
The printed sheet is the top of McEwan’s workbook, not the later 60-session Durbin-Watson window. The last clipped row (23 Oct 2002) is omitted.
Classify the score with critical bounds
Lower and upper critical bounds are read from a table using sample size and the count of independent variables. The worked case uses 60 observations and one independent variable.
A statistic below the lower bound is treated as evidence of positive residual autocorrelation. A statistic above the upper bound is treated as no evidence of autocorrelation. A value between the bounds is inconclusive.
All readings on this track · 15 readings
- 1987Evaluating weekly price cycles with autocorrelation cutoffs
- 1988Serial correlation is not an independence test
- 1988Event-triggered chi-square tests for jittered serial links
- 1988Reverse the rule before you trust the system
- 1990Chi-square evaluation of lagged breadth correlations
- 1990Two-gate out-of-sample tests for trading rules
- 1990Sign-cell correlation, chi-square checks, and lag shifts
- 1998Test serial dependence before you optimize a mechanical system
- 2003How a one-rank rotation is constructed for an offset autocorrelation check
- 2004Constructing first-order residual autocorrelation tests
- 2004A two-stage Durbin-Watson residual screen
- 2011Constructing trend labels from increment correlation atoms
- 2012Overnight versus daytime return evaluation
- 2012Constructing a multi-horizon folded-correlation reversal filter
- 2016Tuning indicators to measured market cycles