2004issue C041
Constructing first-order residual autocorrelation tests
A first-order residual autocorrelation test pairs each residual with the residual from the immediately preceding step, scores that pairing from 0 through 4, and uses tabled lower and upper critical values so serial correlation is treated as present, absent, or undetermined.
- The test compares the residual at each time step with the residual from the immediately preceding step and reports a Durbin-Watson statistic from 0 through 4, with 2 as the reference for no serial correlation.
- Lower and upper critical values are looked up from a table using sample size, independent-variable count, and significance level. The worked lookup uses a sample size of 60 and one independent variable.
- A statistic below the lower critical value is treated as evidence of positive residual autocorrelation. A statistic above the upper critical value is treated as showing no evidence of residual autocorrelation.
- A statistic inside the inconclusive interval, between the two critical values, leaves the presence of autocorrelation undetermined.
What the test compares
A first-order residual autocorrelation test compares the residual at each time step with the residual from the immediately preceding step.
That pairing is first-order autocorrelation: dependence between a regression residual at one sampling date and the residual from the immediately prior date.
How the statistic is scored
The Durbin-Watson statistic is a 0-to-4 residual serial-correlation score formed by pairing each residual with the residual one step earlier.
The resulting statistic takes values from 0 through 4, and 2 is the reference value that indicates no serial correlation.
Looking up the critical bounds
Decision thresholds are a lower critical value and an upper critical value looked up from a table using sample size, the independent-variable count, and the significance level.
Sample size is the number of ordered observations used both to fit the regression and to look up the critical bounds. Independent-variable count is the number of regressors that, together with sample size and significance level, selects the pair of critical bounds.
The worked lookup uses a sample size of 60 and one independent variable.
Reading the three outcomes
A statistic below the lower critical value is treated as evidence of positive autocorrelation among residuals.
A statistic above the upper critical value is treated as showing no evidence of residual autocorrelation.
A statistic that falls between the two critical values sits in the inconclusive interval and leaves the presence of autocorrelation undetermined.
5% Durbin–Watson bounds for one regressor
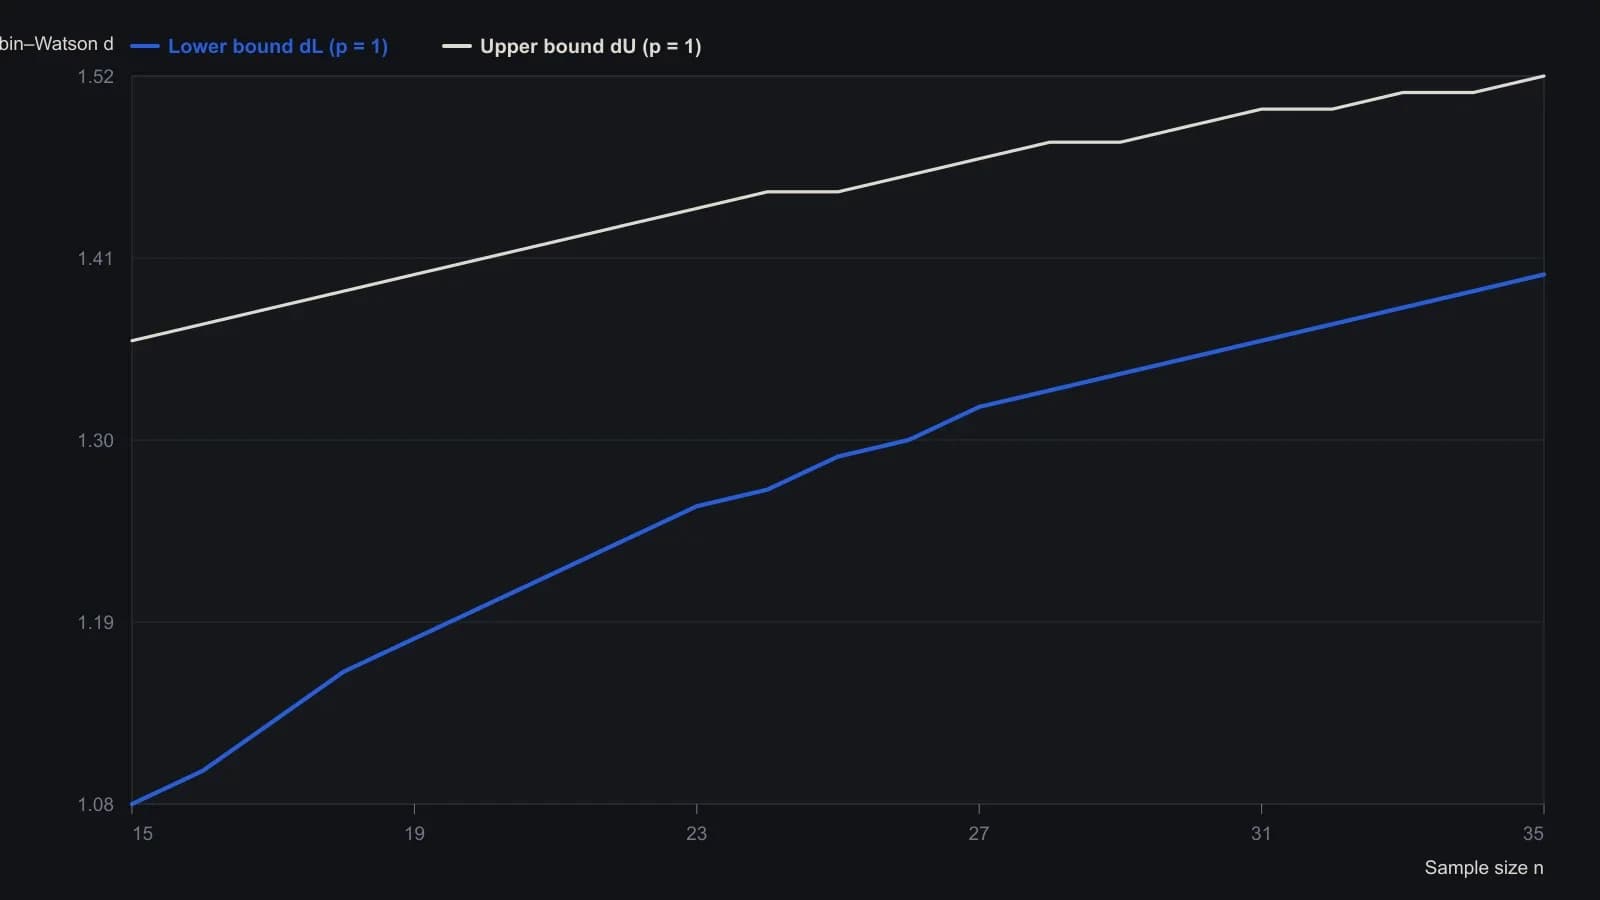
The source table is a 5% test. The sidebar example looks up n = 60 and p = 1; n = 60 is past the last fully visible row, so the plotted bounds stop at n = 35.
All readings on this track · 15 readings
- 1987Evaluating weekly price cycles with autocorrelation cutoffs
- 1988Serial correlation is not an independence test
- 1988Event-triggered chi-square tests for jittered serial links
- 1988Reverse the rule before you trust the system
- 1990Chi-square evaluation of lagged breadth correlations
- 1990Two-gate out-of-sample tests for trading rules
- 1990Sign-cell correlation, chi-square checks, and lag shifts
- 1998Test serial dependence before you optimize a mechanical system
- 2003How a one-rank rotation is constructed for an offset autocorrelation check
- 2004Constructing first-order residual autocorrelation tests
- 2004A two-stage Durbin-Watson residual screen
- 2011Constructing trend labels from increment correlation atoms
- 2012Overnight versus daytime return evaluation
- 2012Constructing a multi-horizon folded-correlation reversal filter
- 2016Tuning indicators to measured market cycles