1994issue C101-10
Evaluating DJIA weakness inside the quarterly futures cycle
The archive dated DJIA selloffs on the three-month stock-index futures cycle and tabulated a mid-cycle weakness window, a later expiration-adjacent window, and an early-quarter advance window against quarter-end markup and reinvestment demand.
- Stock-index futures expirations on the third Friday of March, June, September, and December define a three-month futures cycle used to date cash-index weakness.
- After October 1987, DJIA declines of at least 104 points clustered in a mid-cycle weakness window, and six of eight declines of 200 points or more began in that phase.
- By 1991 a later expiration-adjacent window also appeared, and both tabulated weakness phases were followed by recorded rebounds in the sample.
- From late 1990, last-day-of-quarter sessions and the first four new-quarter sessions did not show a one-sided directional pattern, so quarter-end markup and reinvestment demand can be tested rather than assumed.
The three-month futures cycle as a dating frame
Stock-index futures in the sample expired on the third Friday of March, June, September, and December. Those dates define a three-month futures cycle that the archive used to date cash-index weakness. The cycle opens with a lead-contract phase, when new positions are opened after the prior expiration.
Editorial interpretation: treat that calendar as a regime-evaluation bench for classifying market phases, not as a sheet of trade tips.
The mid-cycle weakness window
In the post-October 1987 sample, DJIA declines of at least 104 points clustered in one brief phase of the three-month futures cycle, and six of eight declines of 200 points or more began in that phase. From October 1987 through mid-January 1992, declines of at least 105 DJIA points were recorded as starting between the 10th and 22nd trading day of the cycle.
That interval is the mid-cycle weakness window. In that 1987 to 1992 window, each tabulated mid-cycle decline of at least 105 points was followed by a rebound of at least 80 points.
DJIA selloffs dated to days 10–22 of the lead futures cycle
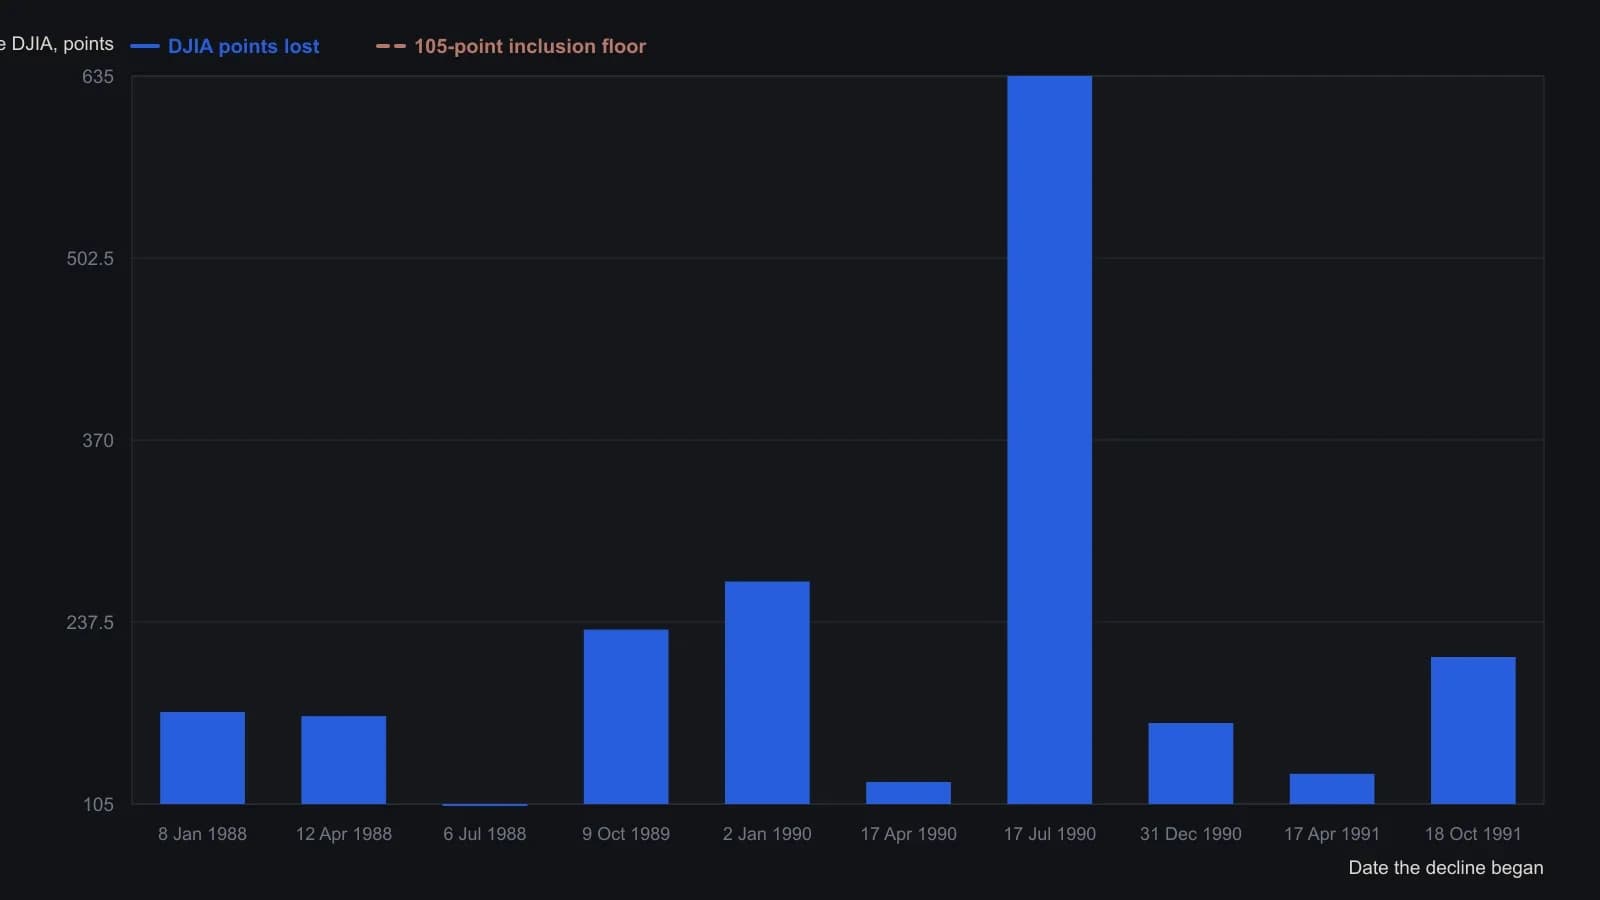
The October 1987 crash is named as the first case in this window but no point total is given in the unit, so it is omitted. The 159-point drop of 8–11 October 1990 is the last leg of the 17 July 1990 decline rather than a new start. The 15 January 1992 episode is given only as 26 S&P 500 points and is omitted to keep the series in DJIA points.
A later expiration-adjacent window
By 1991 the recorded weakness also appeared in the days just before expiration, and from March 1992 it started before or on expiration day in nine of the last 10 cycles in the sample. From March 1991, declines of at least 104 DJIA points were recorded as starting from the 16th day before expiration through expiration day.
That stretch is the expiration-adjacent window, treated as a later and distinct weakness phase. Those expiration-adjacent declines of at least 100 points were followed by rebounds of at least 65 points in the tabulated sample.
Early-quarter advances and quarter-end folklore
From mid-1990, advances of at least 68 DJIA points were recorded as starting between the fourth and 13th day of January, April, July, and October. That interval is the early-quarter advance window, tested as a start-of-quarter lift separate from expiration timing.
Quarter-end markup is the belief that institutions lift holdings on the final session of a quarter because compensation is tied to quarterly results. Reinvestment demand is the belief that institutions buy heavily during the first four sessions of a new quarter. From late 1990, last-day-of-quarter sessions and the first four sessions of the new quarter did not show a one-sided directional pattern in the sample tally.
Editorial interpretation: the dated windows can be checked against that folklore instead of treating markup and reinvestment as given.
Keeping the tests as one procedure
The archive workflow dates selloffs on the three-month futures cycle, separates the mid-cycle weakness window from the expiration-adjacent window, and keeps the early-quarter advance window distinct from expiration timing.
Editorial interpretation: that is how seasonal trading, option-expiration analysis, and seasonality analysis stay one testable procedure for classifying market phases.
All readings on this track · 23 readings
- 1994Selecting option expiration and strike by expected value
- 1994Evaluating DJIA weakness inside the quarterly futures cycle
- 1995Evaluating option-expiration weeks as index regimes
- 2004Index option execution through expiration and volatility context
- 2005Constructing credit spreads around settlement and implied volatility
- 2006Call credit spread execution, leftover premium and expiration decay
- 2006Expiration-aware call construction and automatic exercise
- 2007Expiration, leftover premium, and seasonal context for option construction
- 2007Seven option mistakes in premium, expiration, and implied volatility
- 2008Long straddle construction around implied volatility and expiration
- 2008Option income critiqued through volatility and expiration
- 2011Covered call writing as income holding or buy-write turnover
- 2011A five-day Treasury bond option sale as a market-regime choice
- 2011Session-access gaps, expiration exercise, and spread coverage
- 2011Weekly option tenor construction and premium drivers
- 2012PM-settled index expiration in a defensive sector regime
- 2014Weekly covered-call income and the expiration hold test
- 2016Weekday option expirations as a catalyst-timing overlay
- 2017Overlapping condors and expiration windows
- 2017Small-cap index futures listing change as a margin and options checkpoint
- 2017Pin risk as an expiration-day execution problem
- 2019Stock, index, and futures options as a capital and expiration filter
- 2020Dividend early assignment risk for short calls