2003issue C041-3
Constructing a negative volume index as a moving-average regime test
A negative volume index is built from a volume gate, a price rate of change increment, and a moving-average baseline of the finished series. Editorial view: those three choices turn a bull or bear chart reading into a declared, falsifiable regime test.
- The negative volume index adds the session price rate of change only when volume is lower than in the prior session; the positive volume index adds only when volume is higher and otherwise stays unchanged.
- Both constructions use the same increment: the one-session close-to-close change divided by the prior close.
- The finished series is classified above or below a simple moving average of itself, with a 255-session lookback as the default and a 127-session lookback as a shorter alternative when volatility is higher.
- Taken alone, a declining negative volume index trend is not presented as establishing either an advancing or a declining market regime.
Three design choices
The negative volume index is a running cumulative. It adds the session price rate of change only when that session’s volume is lower than the prior session’s volume.
Editorial view: the build that can be tested is not the plotted line. It is three stated choices: a volume gate, a price rate of change increment, and a moving-average baseline of the finished series. Stating those choices is what lets a bull or bear reading be kept or rejected as a regime test rather than taken as a visual impression.
The volume gate
The volume gate decides whether today’s price rate of change is added to the cumulative or skipped. The decision uses only whether volume rose or fell versus yesterday.
The companion positive volume index adds the session price rate of change only when volume exceeds the prior session’s volume. Otherwise it leaves the cumulative unchanged.
When a composite does not publish a single volume field, daily advancing, declining, and unchanged volume can be summed to supply the volume input.
The price rate of change increment
Both constructions use the same increment: the one-session close-to-close change divided by the prior close. That quantity is the price rate of change.
The illustrated build used closing prices. Other price combinations remain possible.
A moving-average baseline of the series itself
The finished series is classified by whether it stands above or below a simple moving average of itself. That moving-average baseline uses a 255-session lookback as the default and a 127-session lookback as a shorter alternative when volatility is higher.
The illustrated build used a simple rather than exponential moving average.
Nasdaq NVI versus 127-day and 255-day moving averages
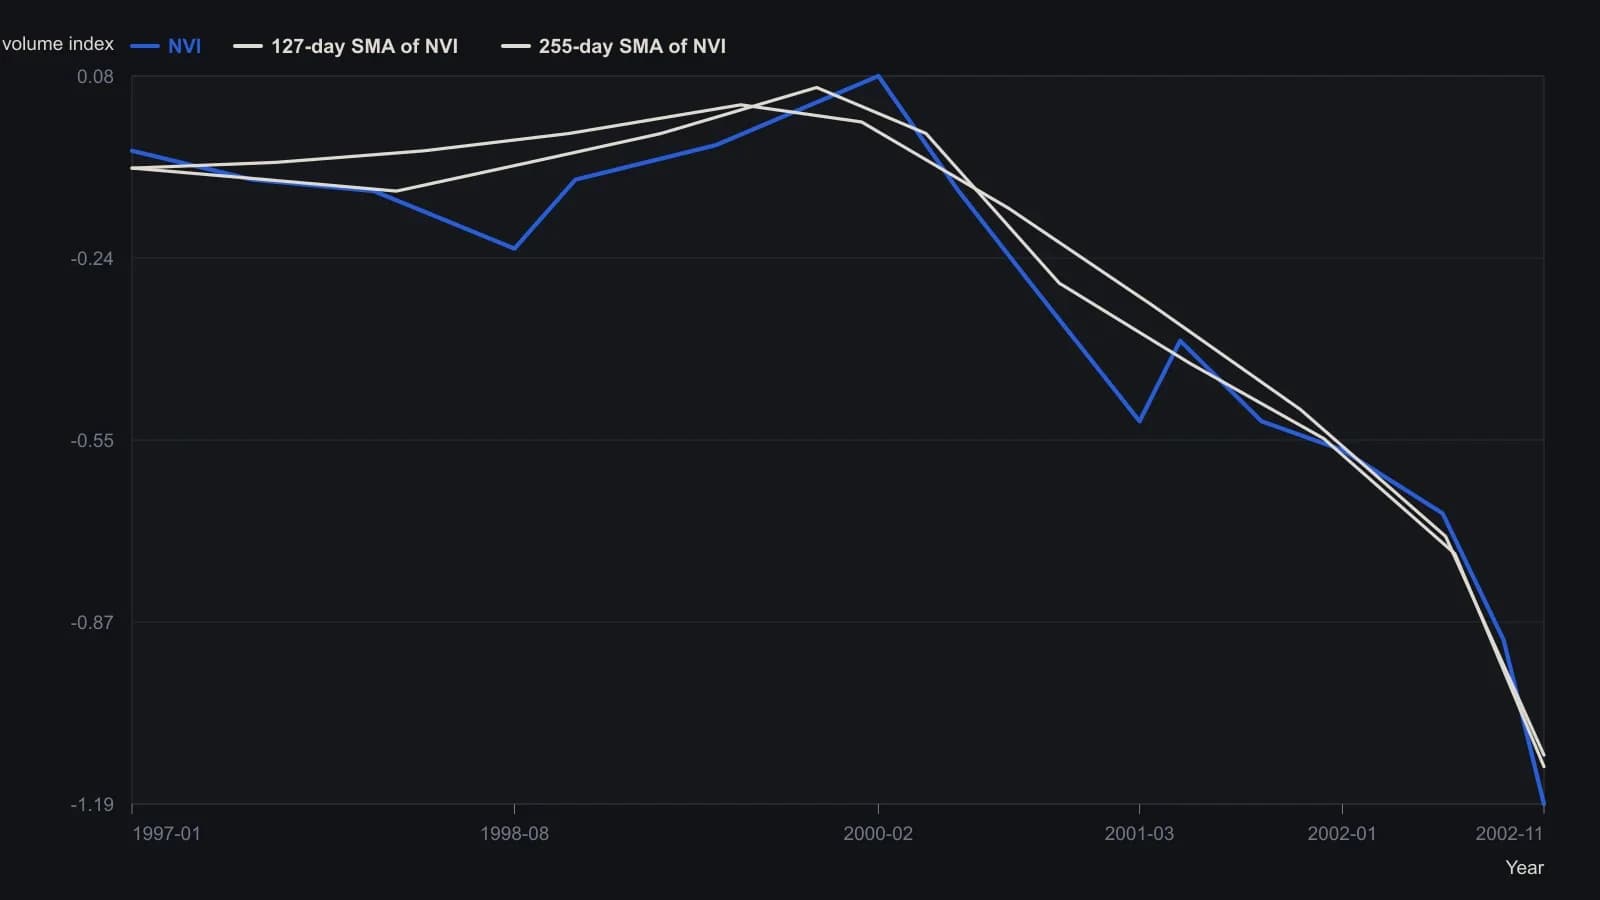
Peterson used a simple moving average of closes, not an EMA, and built Nasdaq volume by adding up, down and unchanged volume. The NVI is an additive running sum of daily price rate of change on down-volume days, so the scale sits near zero instead of a 100-based index.
Significant swings versus noise
A 5% zigzag overlaid on the volume index marks peaks and valleys so smaller oscillations can be treated as noise. Raising that percentage reduces sensitivity and delays the signal.
Peaks and valleys that encompass more of the index are treated as the valid swings for judging whether the series’ momentum is strengthening, because unsustained moves produce repeated reversals. A significant swing is a peak or valley large enough, relative to nearby oscillations, to serve as a momentum reference instead of being treated as noise.
What a declining trend does not establish
Taken alone, a declining negative volume index trend is presented as not establishing either an advancing or a declining market regime.
All readings on this track · 9 readings
- 1986Volume confirmation, the negative volume index, and divergence
- 1990Constructing a signed-range negative volume line
- 1990When quiet-day breadth fails a horizon test
- 1994Stacking scored filters into a hierarchical stock outlook system
- 1996Constructing volume-split and advance-decline breadth signals
- 1996Constructing on-balance volume, volume-price analysis, and the negative volume index
- 1996Constructing volume disparity from percent-b
- 1996Constructing a price-volume percent-B disparity
- 2003Constructing a negative volume index as a moving-average regime test