1996issue C051-8
Constructing on-balance volume, volume-price analysis, and the negative volume index
Technical work treats volume as a required companion to price. This article describes how a chart-window scale is fixed first, then how on-balance volume, volume-price analysis, and the negative volume index are built from the same session series.
- Volume is placed as a vertical bar under each price print and judged only against other bars in the same window.
- Volume-price analysis maps expansion and contraction with price direction as buyer or seller dominance, while noting that other factors can overturn that map.
- On-balance volume adds or subtracts every directional session, while the negative volume index updates only when volume is lower than the prior session.
- Volume is treated as necessary but insufficient: it is not used alone and is not disregarded.
Volume as a companion to price
Technical work treats volume as a required companion to price rather than an optional extra. Charts typically place each session's volume as a vertical bar under the matching price print and judge bar height against other volume bars in that same window.
Fix the visible scale first
Volume bars that fill a short-window scale can remain below the midpoint when the same series is shown over a longer window, so average and extreme volume depend on the period displayed. Chart-window volume scale judges average and extreme volume only against the bars visible in the current lookback, not against an implied all-time range.
Reading directional agreement
Volume-price analysis compares whether volume expands or contracts with the direction of price, using other bars in the same window as the scale. Rising volume with rising prices and falling volume with falling prices are mapped as buyer dominance. Rising volume with falling prices, plus fading volume on rallies, is mapped as seller dominance. Other factors can overturn that map.
Accumulating every session
On-balance volume is built as a running total that adds volume on up-price days, subtracts volume on down-price days, and disregards unchanged-price days. The cumulative total is then compared with the price trend. Because raw on-balance volume can be erratic, a nine-day moving average may be plotted. The indicator's range is set by the visible period. Price highs not matched by on-balance-volume highs are treated as a warning.
Updating only on quieter days
The negative volume index starts at a base of 100. The quiet-day update rule leaves the index unchanged on higher-volume sessions and applies the market percentage change only on sessions when volume is lower than the prior session. A current reading above its one-year average is classified as an uptrend in that index. That classification rests on the construction premise that larger participants are more active on quieter days than on high-activity public days.
Necessary but not sufficient
Volume is treated as necessary but insufficient. It is not used alone and is not disregarded.
Silicon Graphics volume oscillator, 1995
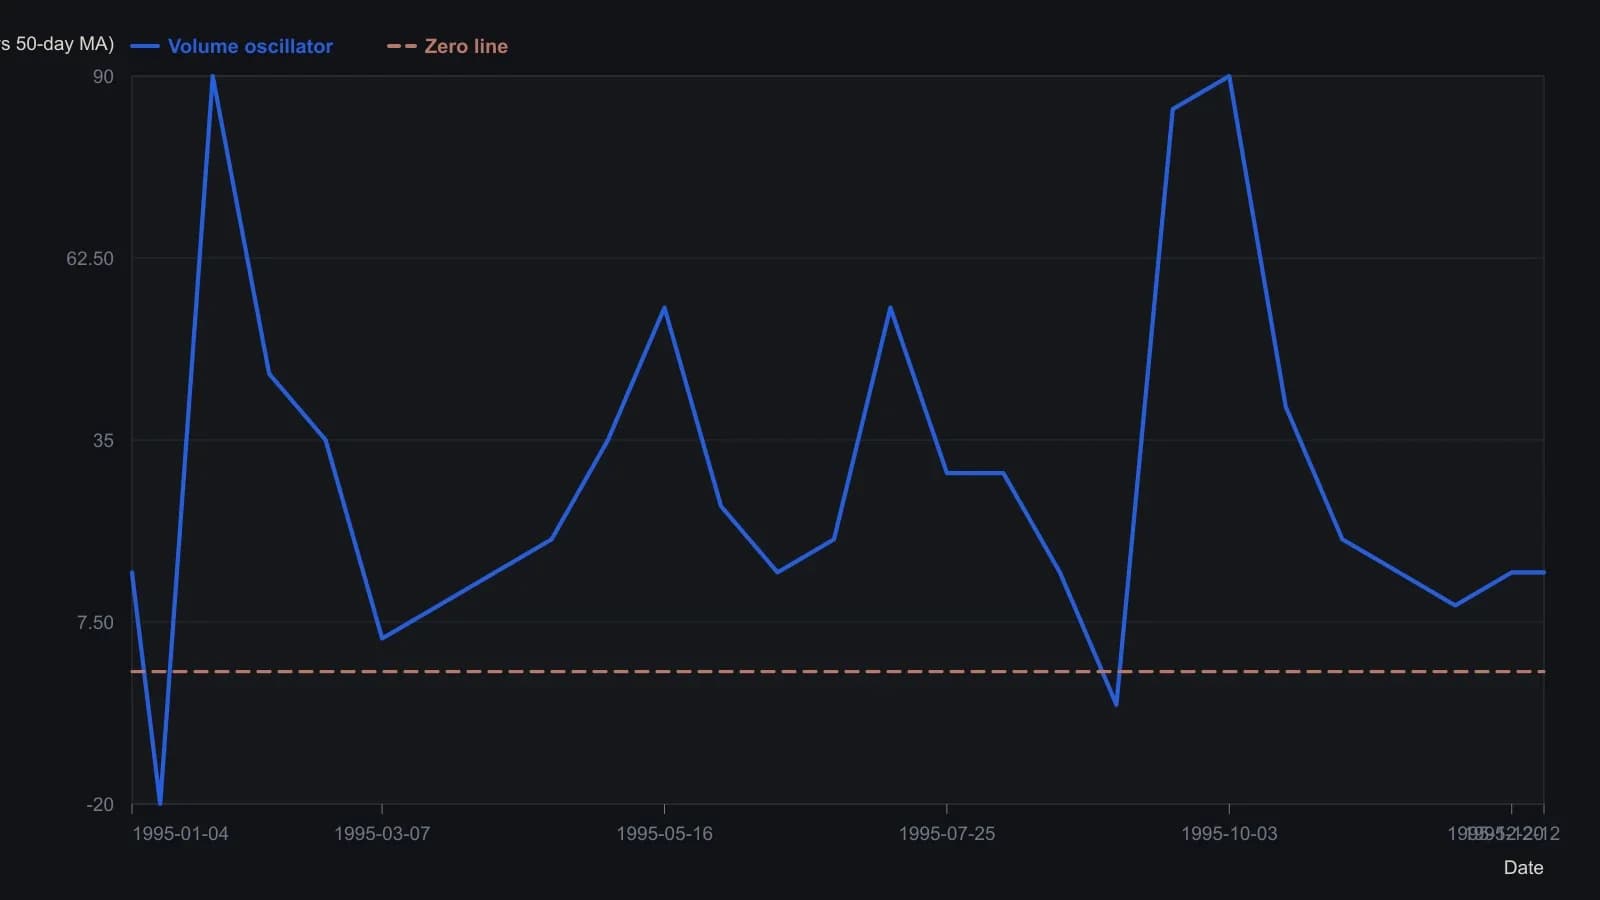
The printed MetaStock window uses a 10-day moving average of daily volume against a 50-day base; the page is dated 20 December 1995. Oscillator values are read off the raster, not from a table.
All readings on this track · 9 readings
- 1986Volume confirmation, the negative volume index, and divergence
- 1990Constructing a signed-range negative volume line
- 1990When quiet-day breadth fails a horizon test
- 1994Stacking scored filters into a hierarchical stock outlook system
- 1996Constructing volume-split and advance-decline breadth signals
- 1996Constructing on-balance volume, volume-price analysis, and the negative volume index
- 1996Constructing volume disparity from percent-b
- 1996Constructing a price-volume percent-B disparity
- 2003Constructing a negative volume index as a moving-average regime test