2001issue C021-3
Constructing volume breadth with a negative volume index and up/down ratios
A capitalization-weighted index can move on only a few names. Volume-based breadth is assembled from total-volume and the split between advancing-volume and declining-volume, then built as a quiet-session Negative Volume Index and a short up/down volume oscillator.
- A capitalization-weighted index can advance or decline on only a few names, so market-breadth is used to measure how widely that move is shared.
- Volume-based breadth is assembled from total-volume and the split between advancing-volume and declining-volume.
- Negative Volume Index applies the latest close-to-close percent change only when today's volume is below yesterday's, and otherwise holds the prior value.
- An up/down volume oscillator is the three-period sum of advancing-volume divided by the three-period sum of advancing-volume plus declining-volume, read against re-entry bands at 0.3 and 0.7.
Breadth as a participation measure
A capitalization-weighted index can advance or decline on only a few names, so market-breadth is used to measure how widely that move is shared.
Volume-based breadth is assembled from two fields: total share activity and the split between advancing and declining volume. Total-volume is the combined share count across advancing, declining, and unchanged issues, used to judge whether a price swing is occurring on expanding or shrinking activity. Advancing-volume is share volume in issues that closed higher. Declining-volume is share volume in issues that closed lower. The two are compared to mark leadership changes.
Shrinking volume against a rising index
A continuing price rise while total-volume is shrinking is treated as diminishing participation rather than confirmation. That reading is a price-volume-divergence: a construction condition in which price continues in one direction while total-volume trends the other way, read as thinning participation.
In December 1999 the Nasdaq Composite kept rising after the sum of advancing and declining volume turned down, forming a price-versus-volume divergence. Nasdaq peaks on March 10 and March 24, 2000 printed 2.0 billion and then 1.6 billion shares. The lower second-peak volume was used to treat the structure as a double top.
A quiet-session cumulative index
Negative Volume Index is a cumulative index that applies the latest close-to-close percent change only on sessions when total-volume contracts, and otherwise holds the prior value. The index is updated only when today's volume is below yesterday's, by applying that close-to-close percent change to the prior index. On equal or higher volume the index is left unchanged.
Nasdaq NVI was built from 1990 using the sum of advancing, declining, and unchanged volume and was compared with a 255-day moving average. Around the 2000 Nasdaq decline, two volume vendors produced NVI moving-average crosses on March 31 and July 28, so the constructed crossing date depends on the volume feed.
Nasdaq Negative Volume Index versus its 255-day average, 1990–2000
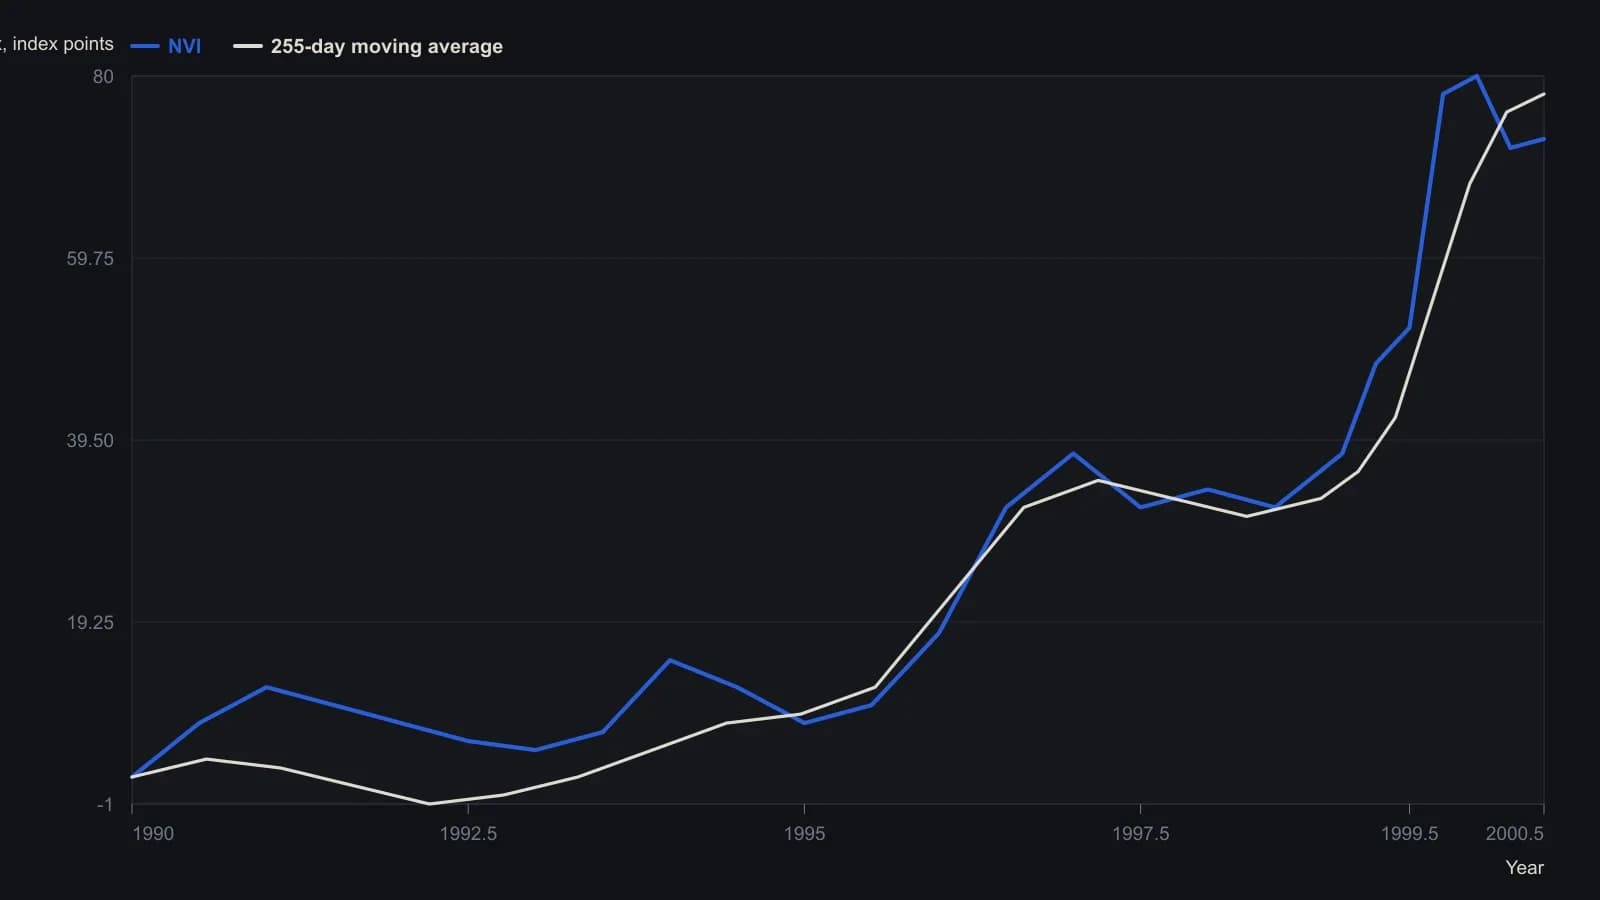
NVI is updated only on days when total volume falls; otherwise it is left unchanged. The source used Nasdaq up plus down plus unchanged volume and noted that vendor volume differences can shift the same crossing by months.
A short up/down volume ratio
Periods when advancing-volume dominates coincide with rising Nasdaq prices. Periods when declining-volume dominates coincide with falling prices. Their crossings mark notable turning points.
An up/down volume oscillator is a short-window ratio of advancing-volume to the sum of advancing-volume and declining-volume, read as a bounded series against fixed re-entry bands. In this construction the oscillator is the three-period sum of advancing volume divided by the three-period sum of advancing plus declining volume, illustrated with re-entry bands at 0.3 and 0.7.
All readings on this track · 6 readings
- 1990Evaluating a weekly up-volume ratio and an hourly oscillator
- 1993Score one swing with volume, bands, and price divergence
- 1993Constructing smoothed stochastics and an up/down volume oscillator
- 2001Constructing volume breadth with a negative volume index and up/down ratios
- 2005Constructing a signed, bounded market-breadth panel
- 2013Constructing an up/down volume oscillator from a web price series