2006issue C041-2
The swing rule as a measured move beyond a broken barrier
Under the swing rule, a later successful break of support or resistance is hypothesized to travel at least as far beyond the barrier as prices originally retreated from it. A 2005 CEPH daily sequence shows how that retreat was sized and how the minimum projection was later checked.
- Common reversal and continuation constructions estimate a minimum post-break path by transferring the height of the pattern beyond the breakout or breakdown.
- Under the swing rule, a later successful break of support or resistance is hypothesized to travel at least as far beyond the barrier as prices originally retreated from it.
- In the 2005 CEPH daily case, a 5.75-point swing from an August low of 38.24 to a July high of 43.99 was added to that high for a 49.74 minimum upside, later exceeded by a late-November close of 50.03.
- Historical usage notes treated the swing projection as a checkpoint at which at least half of a position would be reduced and remaining risk tightened, rather than as a guaranteed terminal price.
A chart answer to discontinuous prices
Swing symmetry is presented as one chart-study answer to the claim that price paths are too discontinuous to anticipate. Markets are treated as patterned expressions of non-random human behavior, so successive advances and retreats can be compared.
A swing chart organizes price around those successive advances and retreats. Support and resistance are the prior stall zones that first halt a trend and later become the barrier a measured swing must break.
How the swing rule sizes the next path
Common reversal and continuation constructions estimate a minimum post-break path by transferring the height of the pattern beyond the breakout or breakdown. A measured move copies the height of a completed swing or pattern and applies that height beyond the breakout or breakdown level.
The swing rule is a measured-move construction that projects a minimum extension after a later break of a previously tested barrier, using the depth of the prior retreat from that barrier. Under that construction, a later successful break of support or resistance is hypothesized to travel at least as far beyond the barrier as prices originally retreated from it.
The result is a minimum projection: the smallest extension implied by the swing construction. The chart is checked first against this level, not against a promised terminal price.
The 2005 CEPH daily sequence
In the 2005 CEPH daily case, late-July highs near 44 acted as resistance after a bounce from below 38. The mid-August stall just above 38 became the retreat low that armed an upside measurement.
That CEPH swing was sized at 5.75 points, from an August low of 38.24 to a July high of 43.99, then added to the July high for a 49.74 minimum upside.
After CEPH cleared the July resistance, it printed an intradaily high of 48.75 on 16 September, then spent a multiweek stretch near the former July highs with only one close below that support. The same CEPH sequence later exceeded the 49.74 swing projection with a late-November close of 50.03.
The projection as a checkpoint
Historical usage notes treated the swing projection as a checkpoint at which at least half of a position would be reduced and remaining risk tightened, rather than as a guaranteed terminal price.
CEPH daily closes, summer–autumn 2005
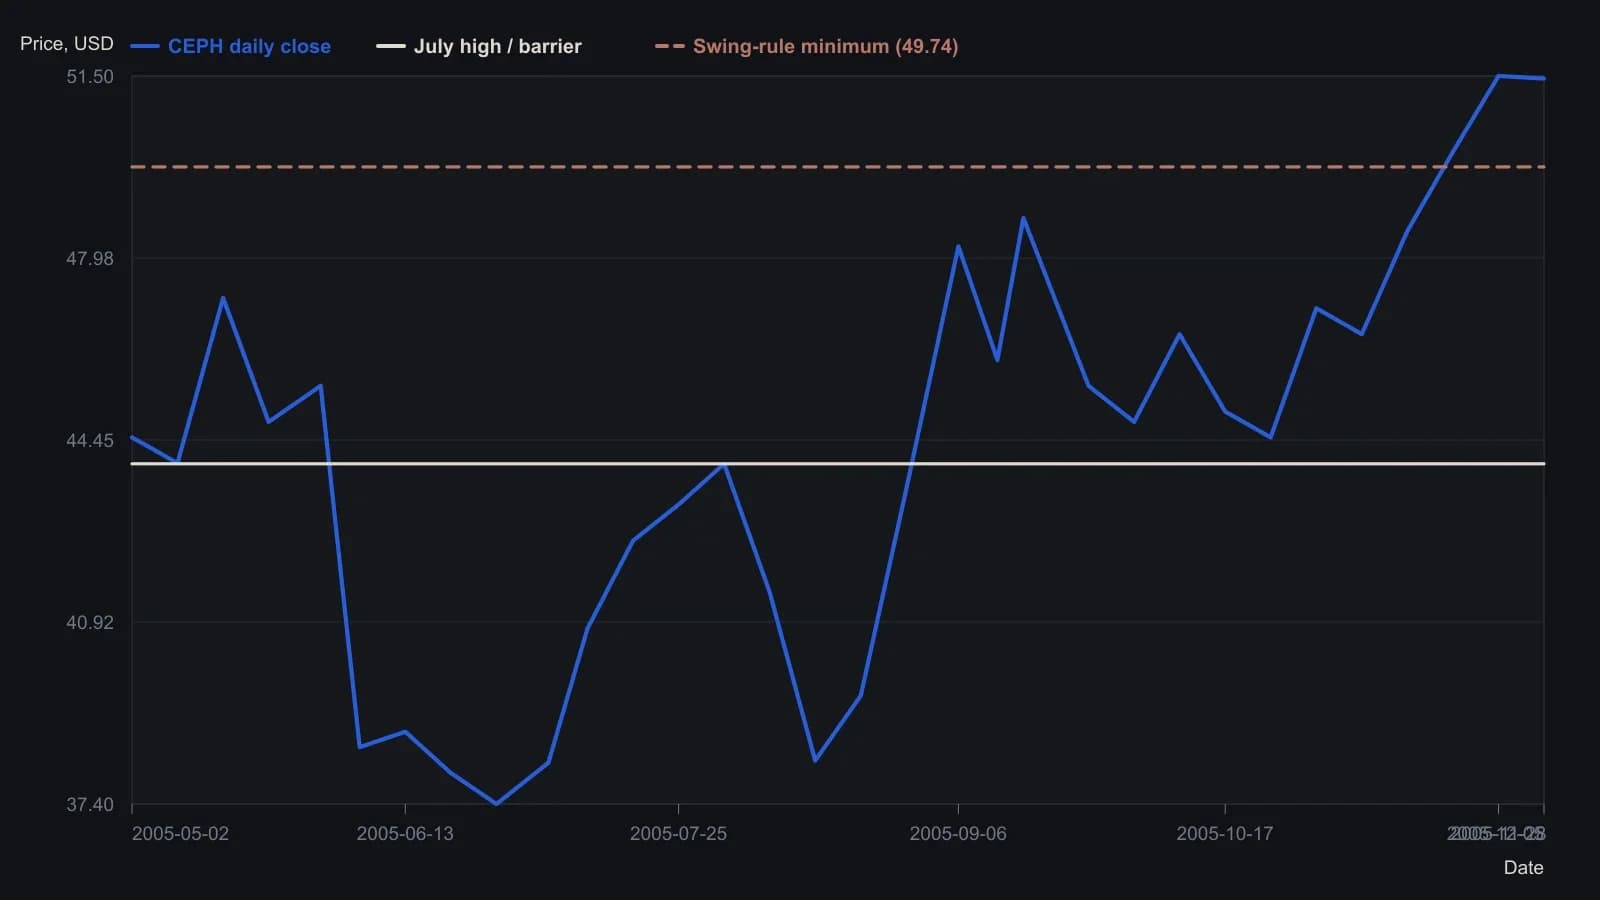
Closes digitized from the Prophet.net daily line; raster limits precision to about 0.25–0.5 point. Text gives the exact swing-rule arithmetic: 43.99 − 38.24 = 5.75, so 43.99 + 5.75 = 49.74.
All readings on this track · 12 readings
- 1990Constructing volume-budget targets after a breakout
- 1991Constructing price objectives from measured moves and swings
- 1997Measuring chart pattern height for breakout targets
- 1998Double-top confirmation before the measured move
- 1998Writing entry, target, and trail as one procedure
- 2005Constructing flag and pennant measured moves
- 2006The swing rule as a measured move beyond a broken barrier
- 2011Prove the X7 turn before measuring the reversal
- 2014Constructing an intraday flag breakout as one procedure
- 2017Price mirrors as a fold-test for reversal targets
- 2017First swing box as a measured-move exit ruler
- 2020The recovered swing high as a halfway-reaction checkpoint