2011issue C1128-32
Prove the X7 turn before measuring the reversal
The X7 construction labels seven swings on a prepared bar chart. A bearish setup draws a baseline through the first and fifth highs, treats the pattern as complete only after a downward baseline break, and only then mirrors a measured projection into a target zone.
- Wave counting comes first: label seven swings on a bar chart that already has swing highs and swing lows marked, and do not treat the X7 as complete until a later down-leg breaks the baseline.
- A bearish setup uses two highs with a lower high between them, a baseline through the first and fifth highs extended to the right, and a seventh-swing label only after that downward break.
- After confirmation, a Measured move mirrors the vertical connector at the seventh-swing high, then adds or subtracts the sixth-swing distance to form a zone rather than a single price.
- In the archive workflow the baseline break is the short-entry condition and the seventh-swing high is the initial stop. Half-size or 1.5- to twofold projections are allowed when price travels through the first zone.
What the X7 construction is
The X7 construction is defined as a sequence of seven labeled market swings on a bar chart that already has swing highs and swing lows marked.
Wave counting is that labeling step. The highs and lows have to be marked before any later line work.
How a bearish setup is located
A bearish X7 setup is located by finding two highs with a lower high between them, then drawing a baseline through the first and fifth highs and extending it to the right.
When the pattern is complete
The pattern is treated as complete only after a later down-leg and a downward break of that baseline, at which point the last high is labeled as the seventh swing.
How the measured projection is built
After the baseline break, a price line is drawn from the second-swing low through the third-swing high and extended relative to the seventh-swing high.
The forecast uses a vertical connector through the seventh-swing high from the baseline to the price line, then mirrors that distance across the baseline as a symmetrical Measured move.
A target zone rather than a single price
The distance from the sixth-swing low to the baseline is added to or subtracted from that mirrored projection to form a target zone rather than a single price.
Worked illustration and a historical oil band
In the worked illustration, the baseline break is the short-entry condition and the seventh-swing high is the initial stop location.
A bullish crude-oil example from December 15, 2010 to February 15, 2011 required the sixth-swing area to be subtracted and produced a projected band from 109.375 to 117.10, with the subsequent advance peaking at 114.825 on May 2, 2011.
Scaled variants
The archive also allows scaled variants: a half-size projection in some cases, and a 1.5- to twofold projection when price travels through the first zone.
Editorial note: Fibonacci projection is the name used here for that resizing step. The archive describes the scale factors, not that name.
Mini-crude 7XZ zone versus the May 2011 high
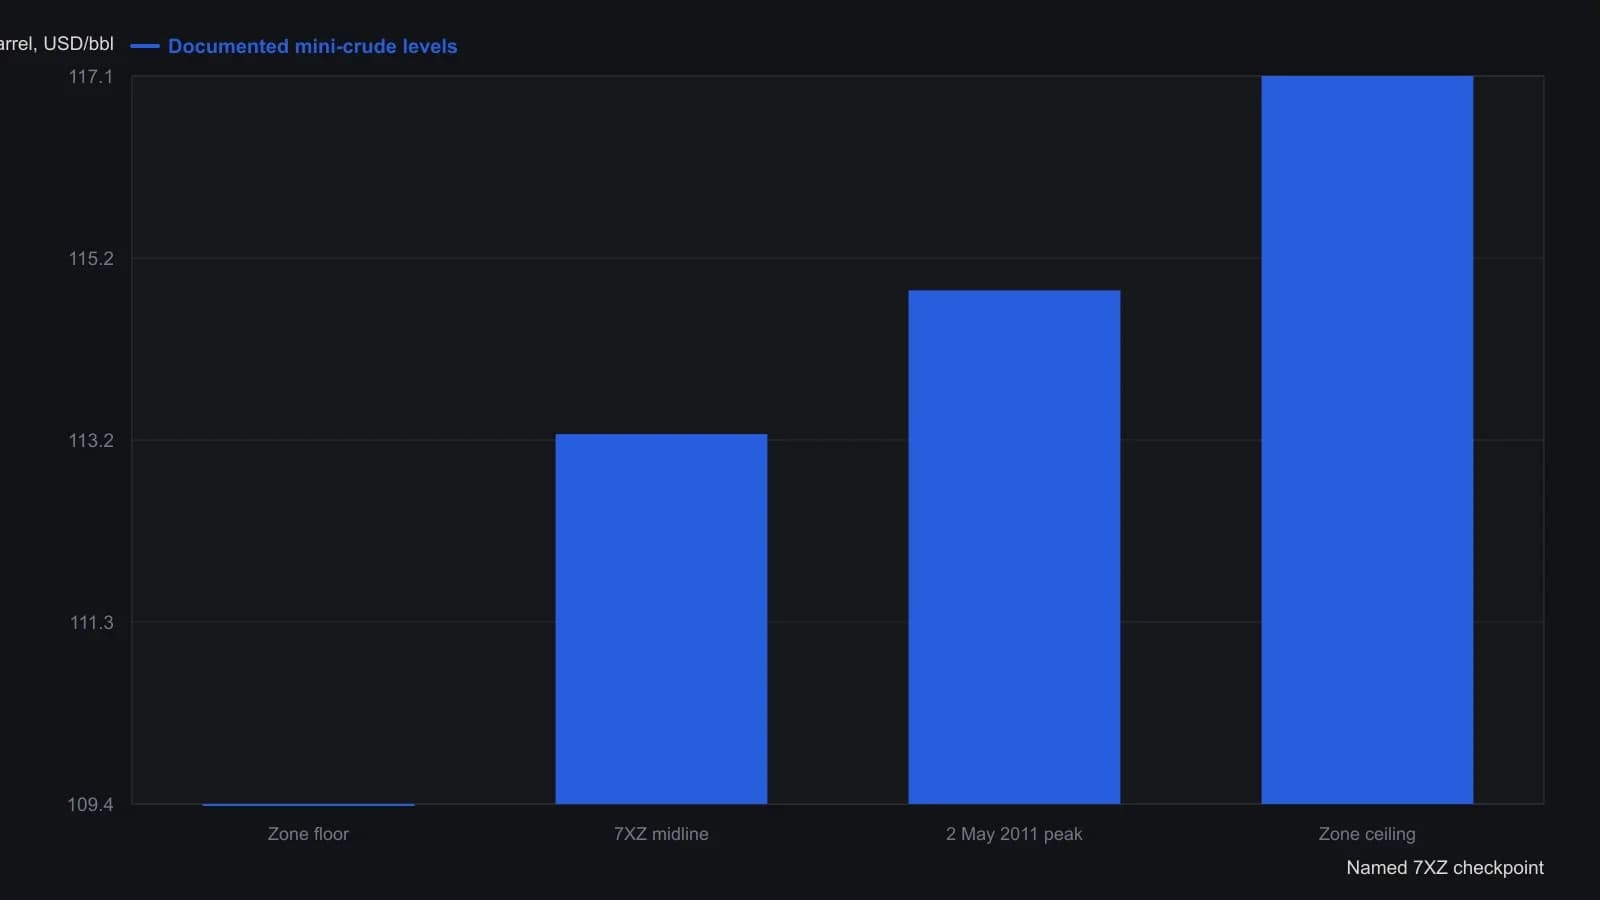
On this contract Sage subtracted the 6X7 height from the mirrored projection, so the 109.375–117.10 band is the reduced zone, not the raw measured move.
All readings on this track · 12 readings
- 1990Constructing volume-budget targets after a breakout
- 1991Constructing price objectives from measured moves and swings
- 1997Measuring chart pattern height for breakout targets
- 1998Double-top confirmation before the measured move
- 1998Writing entry, target, and trail as one procedure
- 2005Constructing flag and pennant measured moves
- 2006The swing rule as a measured move beyond a broken barrier
- 2011Prove the X7 turn before measuring the reversal
- 2014Constructing an intraday flag breakout as one procedure
- 2017Price mirrors as a fold-test for reversal targets
- 2017First swing box as a measured-move exit ruler
- 2020The recovered swing high as a halfway-reaction checkpoint