2017issue C1242
First swing box as a measured-move exit ruler
A historical swing-trading walkthrough marks a first box-trading-range on a 90-day daily candlestick chart, then uses that height both to place a buy-stop-entry and to project a measured-move exit. After the projected target is reached, the procedure can close the position or keep a remainder under a 2-point trailing-stop.
- The first box-trading-range is marked on a 90-day daily candlestick chart from the left-side low to the high that prints just before the first major pullback.
- A buy-stop-entry sits 0.50 above that first boxed high, and the same box height is added to a later box high to project a measured-move exit.
- Once the projected exit is reached, the procedure allows a full close or a partial close with a 2-point trailing-stop on the remainder.
- The same boxed range can also plan a continuation after the first large breakout has already been missed, but completed-range height is only a working estimate.
The archive records a swing-trading walkthrough: a multi-day holding procedure that turns a scanned market state, an entry trigger, a projected exit, and a stay-out or scale-out decision into one testable sequence. The working object on the chart is a first completed box-trading-range.
How the first box is marked
On a 90-day daily candlestick chart, the first box-trading-range is a visually boxed high-to-low segment taken from the left-side low to the high that prints just before the first major pullback. The first box height is that high minus that low.
Scan, buy-stop-entry, and the stacked target
The walkthrough scans names between 20 and 70 per share that show a 90-day low at the lower left and a current uptrend. The buy-stop-entry is a stop order placed 0.50 above the first boxed high, so that only a break of that range becomes the swing entry.
A measured-move in this procedure is a chart-scale hypothesis that the height of a completed price box can be stacked onto a later box high to mark a falsifiable continuation target. The first box height is added to a later box high to project the exit for the next range.
Illustrated case
In the illustrated case, a first box from 33 to 43 is a 10-point range and projects an exit at 53.
After the projected exit
Once the projected exit is reached, the procedure allows a full close or a partial close with a 2-point trailing-stop on the remainder. The trailing-stop is a distance-based exposure rule kept in force after the projected target is reached, so remaining size has a bounded give-back instead of an open-ended hold.
Missed breakouts and the working estimate
The same boxed range is also used to plan a continuation after the first large breakout has already been missed. Recent completed-range height is treated as a working estimate of how far the next swing may travel before stalling. The same run length is not expected on every occasion.
SQM daily price and first-box $53 measured-move target
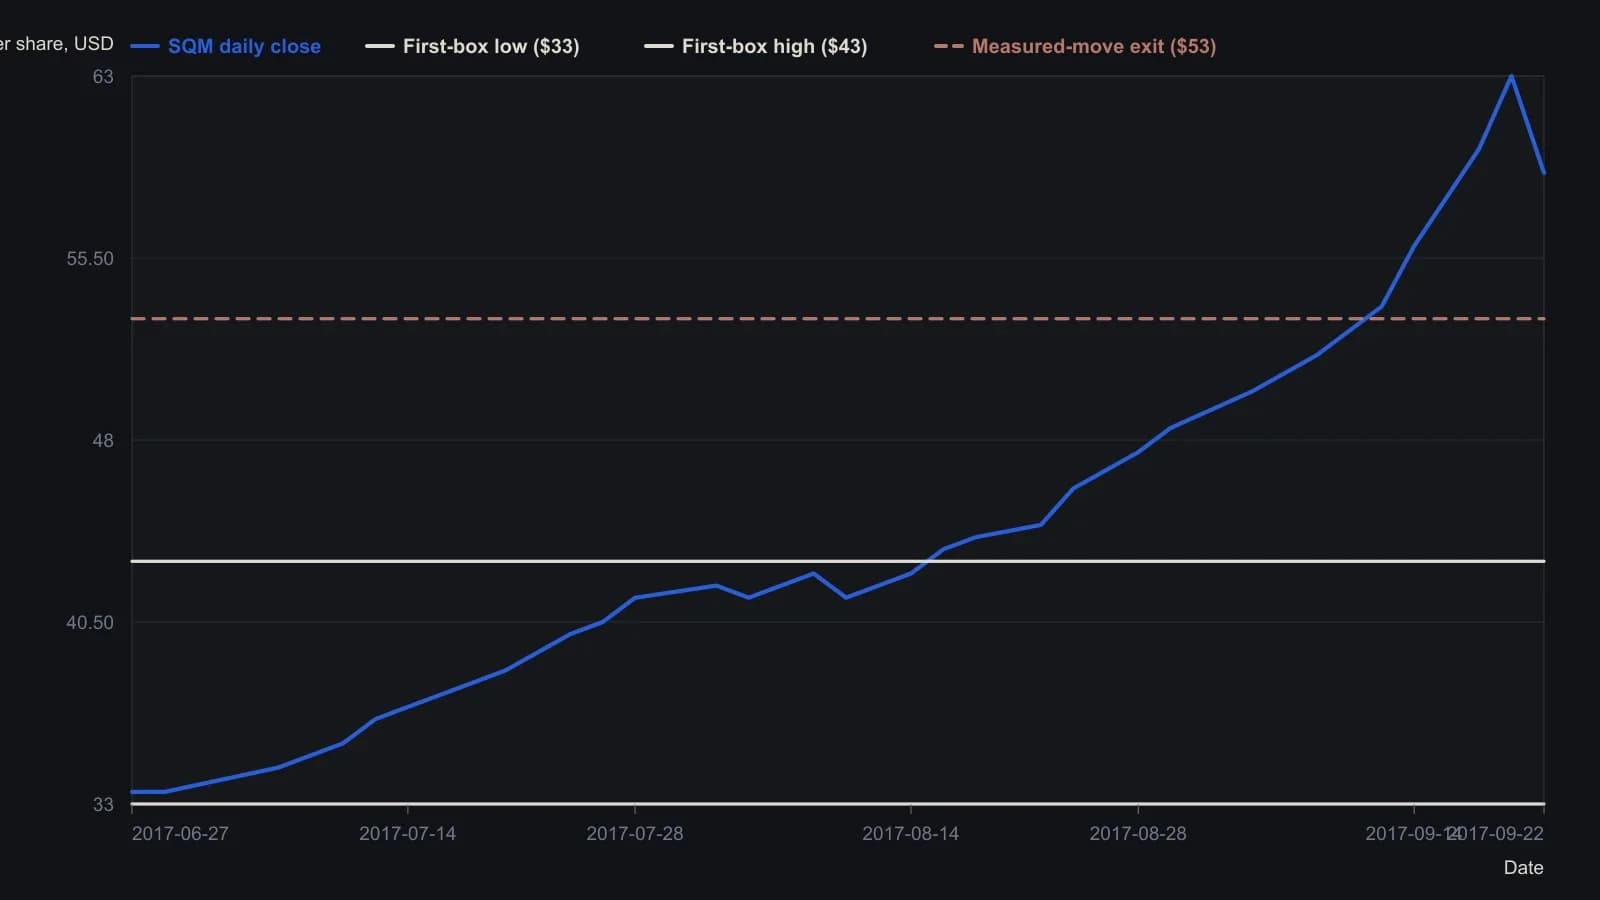
Closes are read off the daily candlesticks to the nearest half-dollar because the source prints no price table. The window is the 90-day daily chart the article specifies (27 June–22 September 2017).
All readings on this track · 12 readings
- 1990Constructing volume-budget targets after a breakout
- 1991Constructing price objectives from measured moves and swings
- 1997Measuring chart pattern height for breakout targets
- 1998Double-top confirmation before the measured move
- 1998Writing entry, target, and trail as one procedure
- 2005Constructing flag and pennant measured moves
- 2006The swing rule as a measured move beyond a broken barrier
- 2011Prove the X7 turn before measuring the reversal
- 2014Constructing an intraday flag breakout as one procedure
- 2017Price mirrors as a fold-test for reversal targets
- 2017First swing box as a measured-move exit ruler
- 2020The recovered swing high as a halfway-reaction checkpoint