2005issue C041-8
Constructing flag and pennant measured moves
Flags and pennants are continuation constructions: a steep pole, a short pause, a breakout through the upper boundary, and a measured-move target tied to pole height. This note shows how each piece was defined so the directional idea can be stated before the breakout and checked against later price.
- Flags and pennants are treated as continuation constructions, so the pause is expected to resolve in the same direction as the preceding steep move and the trade hypothesis is directional before the breakout prints.
- A valid pole required a steep, quick rise of at least 20% from the lowest point of the flagpole, and the pause averaged about 10 trading days, usually staying inside 20 trading days or four calendar weeks.
- Bullish flags are typically two parallel lines that slant against the prior advance, while pennants use two converging trendlines; recognition also depends on a sharp drop in volume through the pause.
- The measured-move target starts from a pole-height projection after the first close or trade through the upper boundary, then can be checked against later price rather than assumed from the textbook rule.
A directional setup before the breakout
Flags and pennants are treated as continuation constructions. The pause is expected to resolve in the same direction as the preceding steep move, so the trade hypothesis is directional before the breakout prints.
A flag-and-pennant is a short pause after a steep advance, drawn as a flag with two roughly parallel lines or as a pennant with two converging lines, that usually resolves in the same direction as the prior move.
Define the pole
A valid pole in this study required a steep, quick rise of at least 20% from the lowest point of the flagpole before the consolidation was counted.
A measured-move later relates that pole height to the expected advance after the pause is resolved.
Draw the pause
The consolidation itself was short. Average length excluding the pole was about 10 trading days, and the pause usually did not exceed 20 trading days or four calendar weeks.
Bullish flags are typically drawn with lower tops and lower bottoms between two parallel lines that slant against the prior advance. A horizontal or with-trend slope was still observed in 25% of the sample.
Pennants are constructed like brief symmetrical triangles: highs and lows bounded by two converging trendlines after the pole.
Volume, daily charts, and semilog scale
Recognition depends on a sharp drop in volume through the pause until the breakout begins. Because the setup is brief, the source treats these forms as daily-chart constructions and, for measuring, as semilog-scale constructions.
Confirm the breakout
A breakout is the first close or trade through the upper boundary of the pause, used to confirm that the continuation hypothesis is active.
Project a measured move that can be checked
A measured-move is a price-target construction that relates the height of the pole to the expected advance after the pause is resolved. The measured-move hypothesis starts from the classical pole-height projection, but the source tests whether that textbook formula remains an adequate target after a 2003-04 sample of 100 bullish flags, pennants, and similar short consolidations.
Breakout magnitude was strongly related to pole height, with a correlation coefficient of 0.68, and also rose with stock volatility. A steeper correction inside the pause and a shorter pause duration were associated with a more forceful breakout.
Eight worked flags: actual breakout, fitted target, and pole height
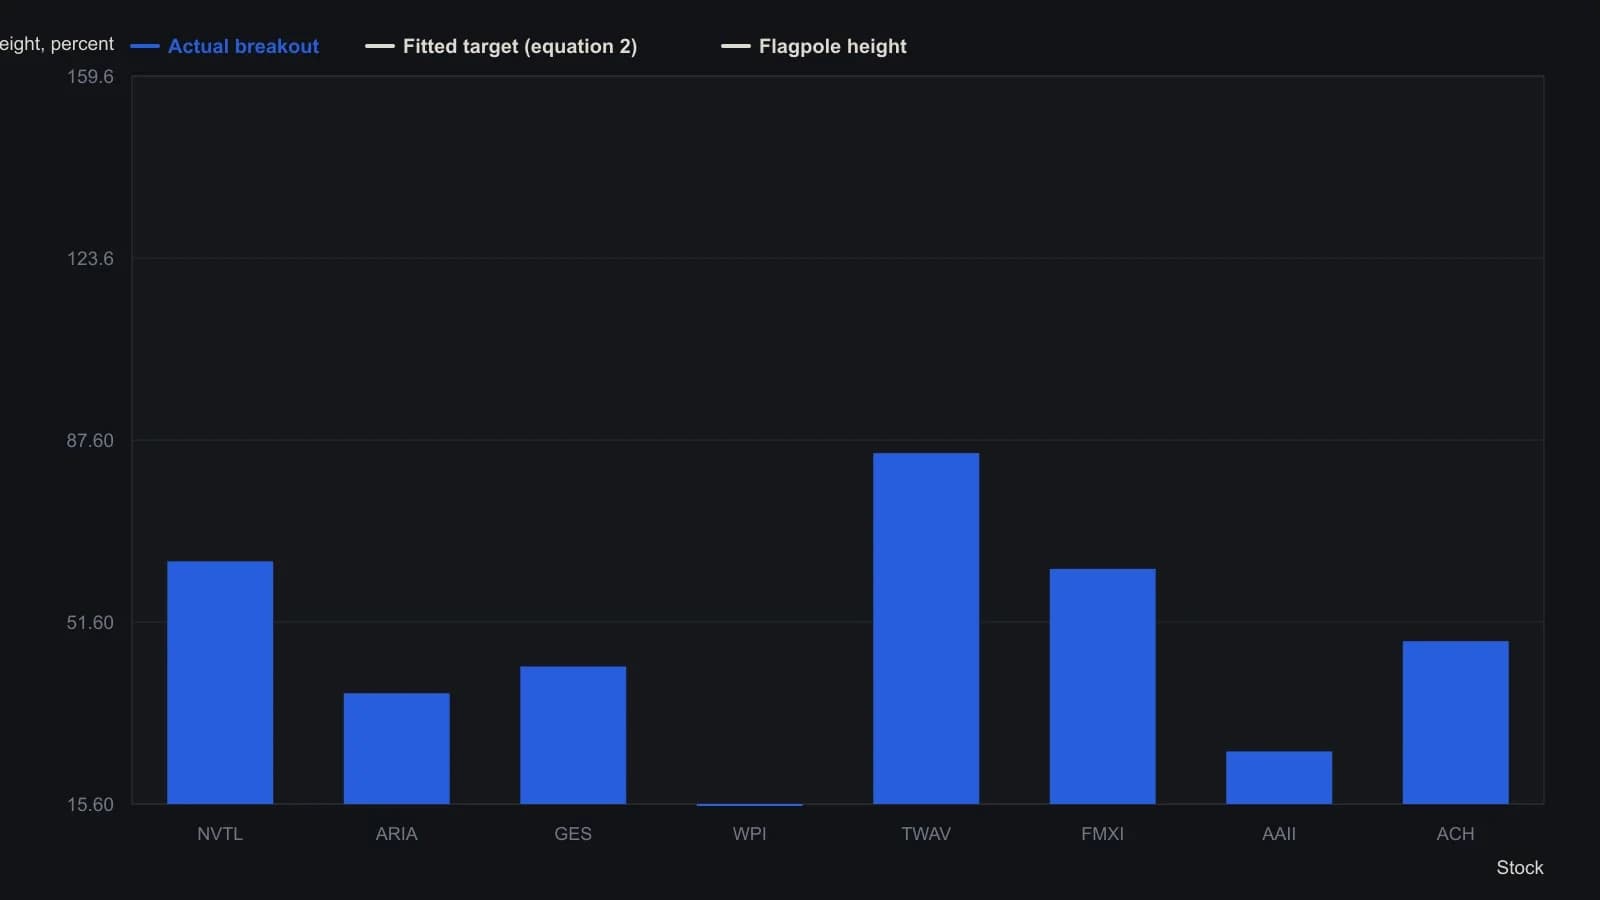
Bullish-only daily patterns from 2003–04; bearish flags after declines were excluded. Breakout percent is from the close at the upper-trendline break to the first short-term top. The fitted series is equation 2 (log pole and formation volatility). These eight rows are a worked sample, not the full 100-pattern study.
All readings on this track · 12 readings
- 1990Constructing volume-budget targets after a breakout
- 1991Constructing price objectives from measured moves and swings
- 1997Measuring chart pattern height for breakout targets
- 1998Double-top confirmation before the measured move
- 1998Writing entry, target, and trail as one procedure
- 2005Constructing flag and pennant measured moves
- 2006The swing rule as a measured move beyond a broken barrier
- 2011Prove the X7 turn before measuring the reversal
- 2014Constructing an intraday flag breakout as one procedure
- 2017Price mirrors as a fold-test for reversal targets
- 2017First swing box as a measured-move exit ruler
- 2020The recovered swing high as a halfway-reaction checkpoint