2020issue C0714-17
The recovered swing high as a halfway-reaction checkpoint
The recovered first peak is the halfway-reaction checkpoint on a swing chart. Copy first-leg height into a twin-peak target, then write the target window and the swing-low invalidation that would falsify the measured-move idea before price arrives.
- The halfway-reaction measure treats the recovered first peak as the midpoint of the two-leg journey, so the measured move copies first-leg height onto that same peak.
- The implied second high equals twice that peak minus the intervening valley.
- A later peak within 1 percent below the calculated high, or anywhere above it, counted as a hit, while a penny under the swing low after recapturing the first peak counted as invalidation.
- In the bull-market sample, 43 percent of candidates were invalidated before the projected high.
The recovered peak is the midpoint
A swing chart is a peak-and-valley price map used to label the first high, the intervening low, and the later recovery high as one measurable structure. The halfway-reaction measure treats the recovered first peak as the midpoint of the full two-leg journey, so the original high is the reaction level against which the twin-leg target is judged.
Copy first-leg height onto the same peak
The measured move is a projection that copies the height of a completed peak-to-valley swing onto the next advance by adding that height back to the same peak. First-leg height is the difference between the isolated swing high and the lowest print that follows it before price recaptures that high.
The swing projection copies first-leg height onto the same peak, so the implied second high equals twice that peak minus the intervening valley. The setup is framed as an uncommon, large peak-to-valley decline, with published illustrations using drops of 37 percent, 42 percent, and 65 percent and one worked example measuring 39 percent.
How the archive isolated the swing
A daily-bar scan from January 1990 through February 2020 located 21,120 candidates across 1,320 issues after requiring at least a 5 percent first-leg drop and removing the two 2000s bear markets. The first peak was the highest high inside a 21-session window, and the swing low was the lowest print between that peak and a later return to the same high, provided the drop finished within a year.
Score the target window and the fail
A later peak within 1 percent below the calculated high, or anywhere above it, counted as a hit with no time limit. That scoring band is the target window: it begins one percent below the calculated price and can extend above it to classify near misses and overshoots.
A penny under the swing low after recapturing the first peak counted as invalidation. That later print is swing-low invalidation, treated as a failed projection.
NVDA swing: first-leg height copied onto the recovered peak
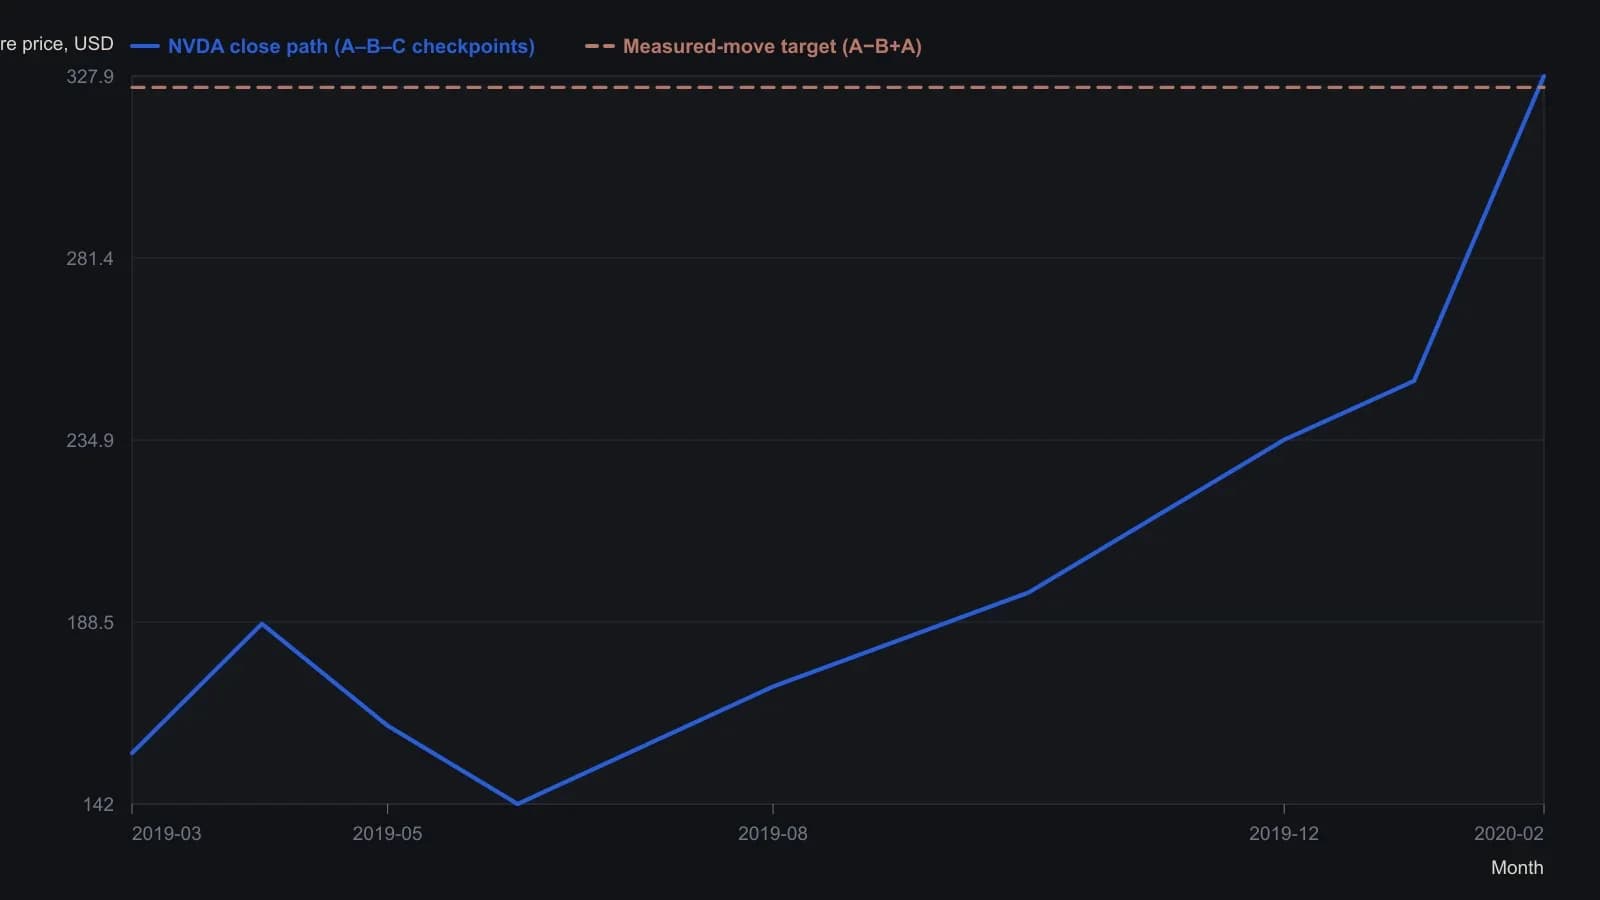
Target is C=A−B+A. The article treats a print at or within 1% of that level as a hit and a break a penny under B after the recovery to A as the invalidation.
What the bull-market sample recorded
In that bull-market sample, 43 percent of candidates were invalidated before the projected high, while 26 percent of peaks sat inside a plus-or-minus 1 percent band, 57 percent inside a -1 percent to +5 percent band, and 76 percent inside a -1 percent to +10 percent band.
Decade slices that did not cross a decade boundary recorded hit frequencies of 55 percent in the 1990s, 60 percent in the 2000s, and 62 percent in the 2010s, or 57 percent across 20,537 qualifying swings from 1990 through 2020.
Larger first-leg declines coincided with higher historical hit rates, from 53 percent in the 5 to 10 percent dip bucket to 83 percent in the 50 to 100 percent bucket, and a 37 to 65 percent dip filter produced a 74 percent hit rate.
Time from valley to the projected high
Each recovery leg took about twice as long as the original peak-to-valley drop, and the full rise from the swing low to the projected high took 4.1 times as long as that first-leg decline.
All readings on this track · 12 readings
- 1990Constructing volume-budget targets after a breakout
- 1991Constructing price objectives from measured moves and swings
- 1997Measuring chart pattern height for breakout targets
- 1998Double-top confirmation before the measured move
- 1998Writing entry, target, and trail as one procedure
- 2005Constructing flag and pennant measured moves
- 2006The swing rule as a measured move beyond a broken barrier
- 2011Prove the X7 turn before measuring the reversal
- 2014Constructing an intraday flag breakout as one procedure
- 2017Price mirrors as a fold-test for reversal targets
- 2017First swing box as a measured-move exit ruler
- 2020The recovered swing high as a halfway-reaction checkpoint