2001issue C081-6
Smoothing balance of market power with a moving average
Balance of market power is a signed bar-range series built from open, high, low, and close. The plotted forecast is a moving average of that series over a chosen lookback, not the raw per-bar fraction.
- The raw per-bar series is close minus open, divided by high minus low, from ordered open, high, low, and close observations.
- An expanded form averages three bullish range fractions and three bearish range fractions, then subtracts the bearish average from the bullish average.
- The plotted forecast is a moving average of the constructed series, with a default lookback of 14 sampling intervals that can be replaced.
- The same series can carry a dual-average overlay, including a 14-interval and a 95-interval moving average, as an explicit quantitative baseline.
From bar fractions to a forecast
Editorial: A bar-range oscillator is a construction problem first. Competing open, high, low, and close reward terms are collapsed into one signed series. An explicit lookback average then makes the forecast the smoothed series rather than a raw bar fraction.
The raw per-bar series is constructed from ordered open, high, low, and close observations as close minus open, divided by high minus low. That signed series is balance of market power: it compares bullish and bearish fractions of the high-low range and is algebraically equivalent to close minus open divided by high minus low.
Equivalent reward constructions
An expanded construction averages three bullish range fractions and three bearish range fractions, then subtracts the bearish average from the bullish average.
The same smoothed series can be built by first defining open-based, close-based, and open-close reward components, then averaging each side and subtracting.
Lookback as the plotted forecast
The plotted forecast is a moving average of that constructed series over a defined lookback. Here a moving average is a lookback average of the constructed per-bar series, used to turn the raw balance of market power fraction into a plotted forecast over a chosen sampling interval.
The default length is 14 sampling intervals. Lookback is an editable construction parameter and can be replaced with another chosen number of periods. A simple moving average is an unweighted average of the most recent lookback values of the constructed series.
Dow 14-bar balance of power, 2001
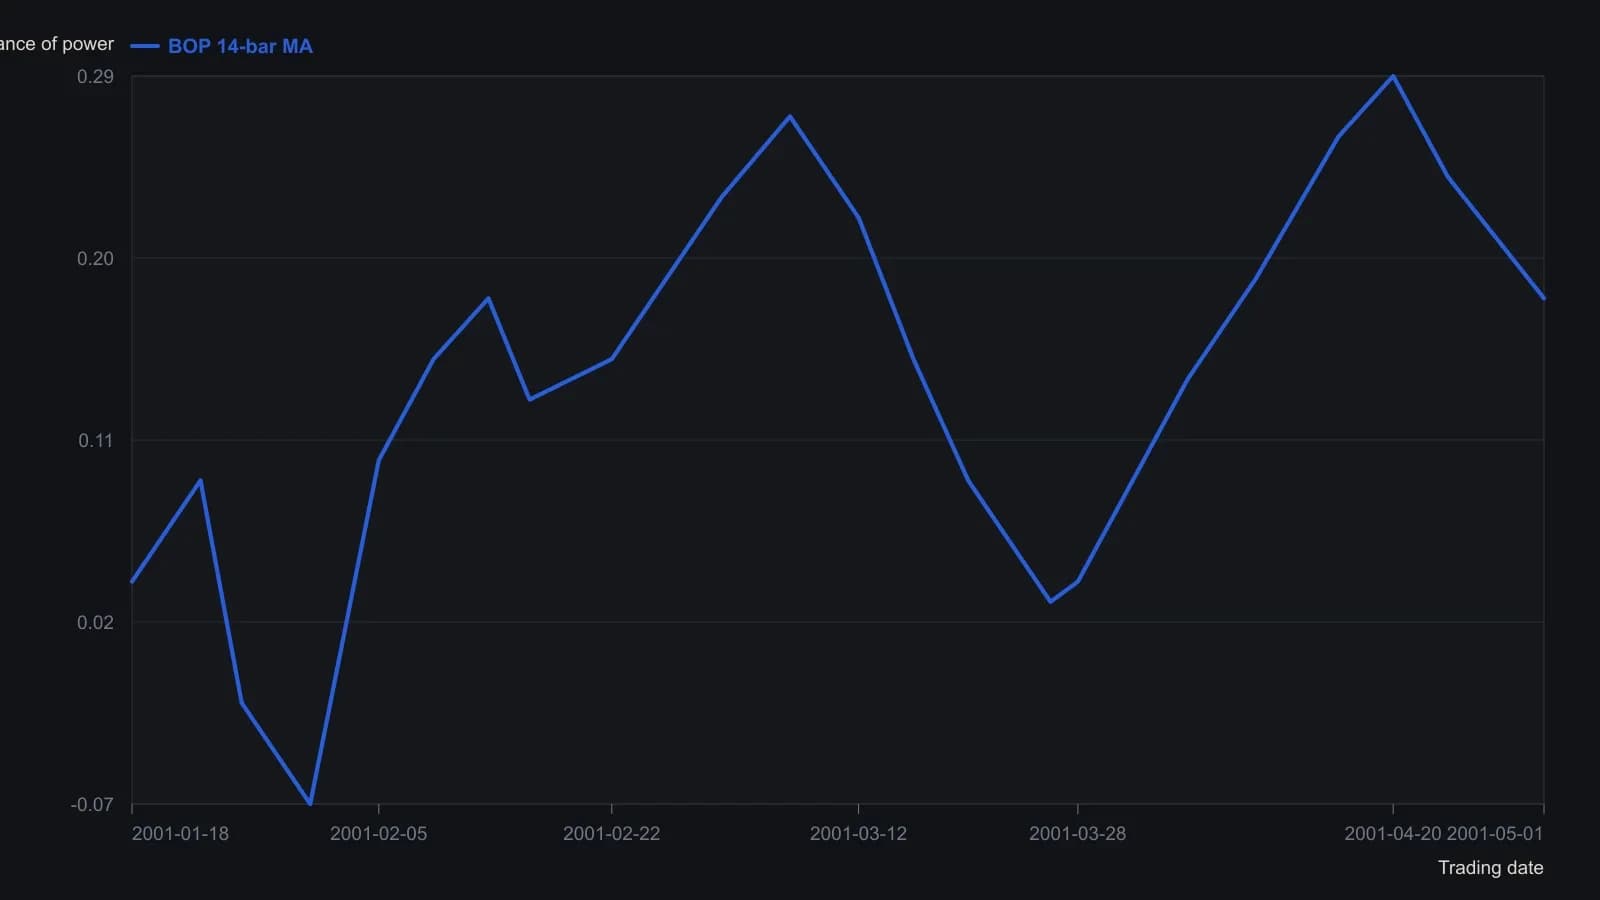
The plotted forecast is Mov_avg(BOP,14), not the raw bar fraction. Last-bar BOP in the quote pad was −0.7410 with BOP_14MA 0.1849 on 1 May 2001. Digitized from the lower-pane 0.06 grid; y is approximate to about 0.02.
A dual-average baseline
A dual-average overlay of the same constructed series can use more than one lookback, including both a 14-interval and a 95-interval moving average, as an explicit quantitative baseline.
All readings on this track · 15 readings
- 1990Building a percent-difference moving-average oscillator
- 1991Ease of movement oscillator construction
- 1993A twelve-month moving-average filter for inflation direction
- 1993Constructing two-endpoint JSA moving averages
- 1999Centered moving averages for trend construction
- 2000Constructing a slope-corrected moving average
- 2000Lookback length as a construction check for the modified moving average
- 2001Smoothing balance of market power with a moving average
- 2005Three-state moving-average directional breakout construction
- 2005Constructing a move-adjusted moving average
- 2005Moving-average construction: windows, weights and stops
- 2008Constructing stacked moving-average filters
- 2011Constructing percentage-offset moving-average bands
- 2015Linearity, commutation, and ratio smoothing in moving averages
- 2019Constructing a 50-200 sma-channel for swing entries and exits