1988issue C051-7
Relative strength spreads against a commodity index
A commodity-basket future can serve as a shared unit of account so ranking, pair direction, and pair admission run as one procedure. Components are compared on the same lookback in rebased ratio space, the ratio trend is read as the long-short signal, and only spreads whose cross-market relationship can be stated before entry are sized.
- Relative strength in this workflow is a ratio line formed by dividing one market by another, not Wilder's bounded oscillator of the same name.
- A rebased-relative-ratio ranks components against the same basket over the same lookback, which raw price ratios do not show.
- A rising component-to-index ratio is a candidate to be long the component and short the index; a falling ratio is the reverse.
- Correlation-analysis admits only pairs whose co-movement is strong enough to treat as a spread, then notional-matching or a regression states how many contracts belong on each leg.
Three methods, one unit of account
Commodity-spread-trading is a paired long-and-short procedure whose outcome depends on the change in relative value between a component market and a basket future, including an explicit rule for how many contracts belong on each leg.
Intermarket-analysis places one commodity against that multi-market basket, and against related financial markets, so a single pair is chosen in a broader regime rather than from that market's price chart alone.
Correlation-analysis is a statistical screen of how tightly a candidate market has moved with the basket, used to keep only pairs whose co-movement is strong enough to treat as a spread.
Editorial reading: treat the basket future as a shared unit of account so those three methods fire as one testable sequence. Rank components on an identical lookback in rebased ratio space, read the ratio-chart trend as the pair signal, then admit and size only those spreads whose cross-market relationship can be stated before entry.
The basket as the common benchmark
The common benchmark is described as an unweighted geometric average of 21 commodity futures markets first published in 1957 and later listed as a futures contract that can serve as the commodity-side analogue of a broad equity index.
Ratio charts are preferred to arithmetic price-difference charts when pairing the basket with individual commodities because those markets are quoted in incompatible units.
Rank on a rebased-relative-ratio
A relative-strength-ratio is a comparison formed by dividing one market by another and charting the result, used to judge outperformance versus a basket and not as a bounded internal oscillator. A rebased-relative-ratio resets that comparison to 100 at a common start date so two markets can be ranked by percentage change versus the same basket over the same lookback.
Over a 100-trading-day window, a rebased soybean-to-index relative ratio of 133.2 and a gold-to-index relative ratio of 98.9 showed soybeans outrunning the basket by 33 percent while gold lagged by about one percentage point. The raw 2.64 versus 2.10 price ratios did not convey that gap.
The ratio line is the pair signal
The directional rule is read from the ratio line. A rising component-to-index ratio is treated as a candidate to be long the component and short the index. A falling ratio is treated as the reverse.
Trendlines, moving averages, oscillators, and price-versus-ratio divergence are applied to that line.
Correlation as the pair filter
Correlation is used as a pair filter. A +100 percent reading associates a 1 percent move with a 1 percent same-direction move in the index. A -100 percent reading associates a 1 percent move with the opposite direction. Values between +50 percent and -50 percent are treated as unreliable.
Over a 12-month window, the strongest positive correlations with the index among components included gold at 87 percent, corn at 84 percent, soybeans at 83 percent, soybean meal at 79 percent, silver at 74 percent, cotton at 71 percent, and heating oil at 61 percent.
How many contracts on each leg
Notional-matching sizes the two legs so current contract values are approximately equal, without adjusting for different volatilities. At the cited prices, one index contract was valued at $117,500 (235.00 times $500) and one gold contract at $49,500 ($495 times $100), implying about 2.4 gold contracts per index contract.
Dollar-value matching ignores relative volatility. Fitting a regression to the two price series is presented as an alternative that accounts for those rates but also tends to reduce the spread's potential profit.
Inverse pairs in the broader regime
Financial markets were characterized as typically inverse to the commodity basket, with Treasury bond futures at -78 percent and the U.S. Dollar Index at -53 percent during 1987. Inverse-pair-construction implements that negative relationship by taking the same directional side in both the basket and that market, long both legs or short both legs, instead of going long one and short the other.
Cotton/CRB relative ratio with cotton and CRB prices
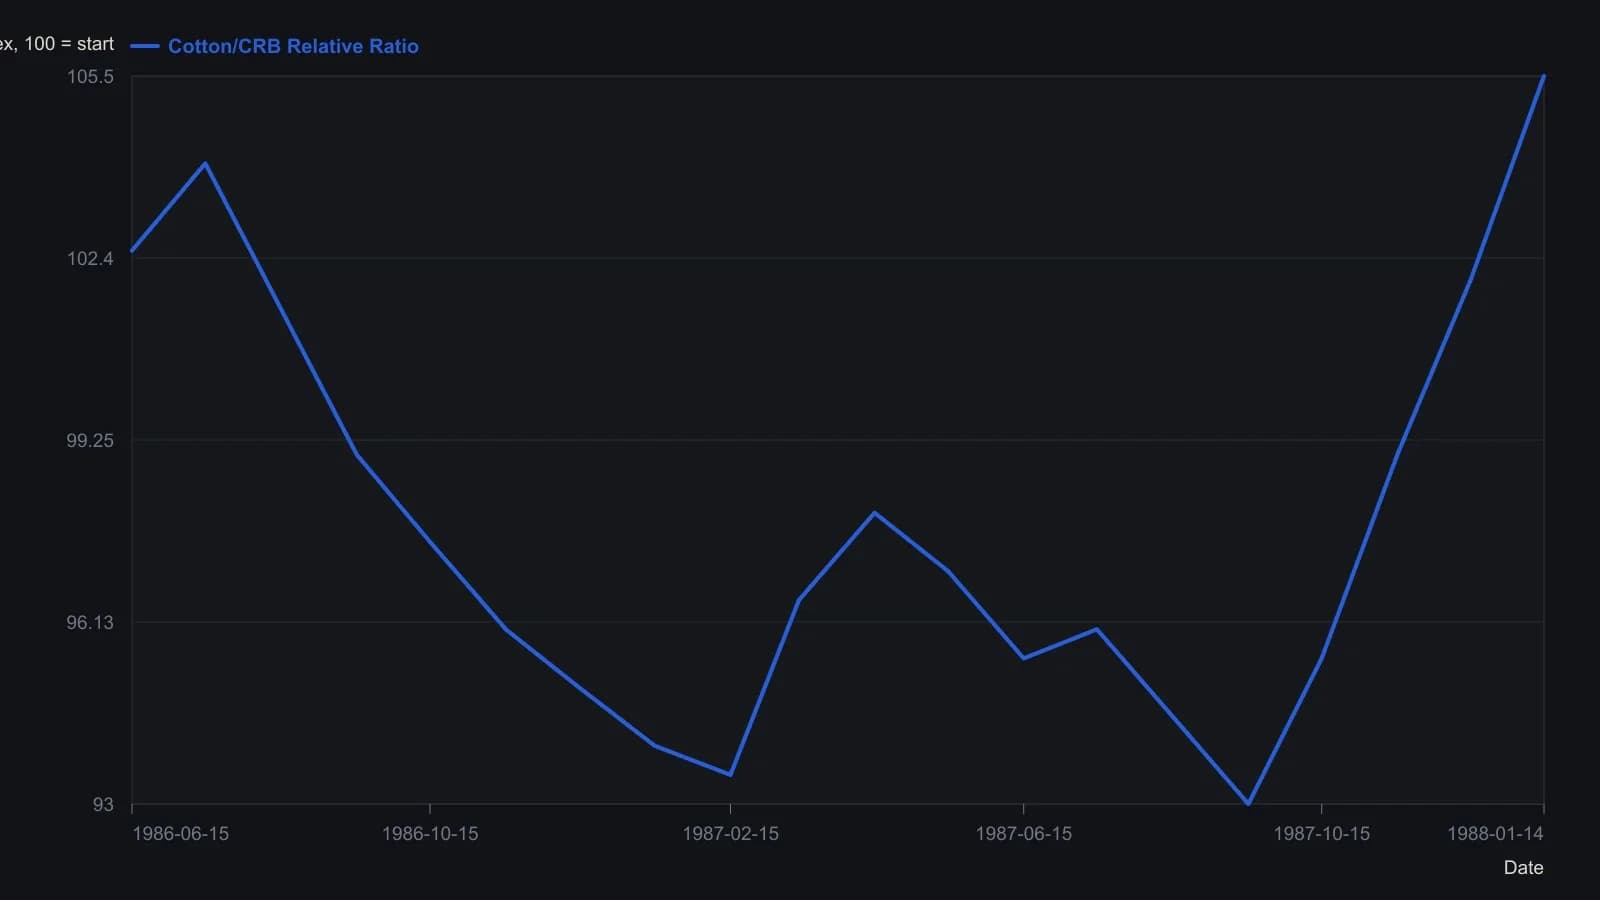
Knight-Ridder Relative Ratio rebases the cotton/CRB quotient to 100 at a user start date; y values are approximate readings from a coarse 1988 raster.
All readings on this track · 17 readings
- 1987Seasonal commodity spreads as portfolio slots
- 1987Underwriting a seasonal livestock calendar spread
- 1987Calendar gates for outright seasonal portfolios
- 1988Relative strength spreads against a commodity index
- 1989Evaluating mechanical seasonal date rules for commodity spreads
- 1991Regime gates for intermarket and spread trades
- 1997A decision-logic filter for the July-November soybean spread
- 1997Seasonal wheat and corn spread windows
- 1997Seasonal filters for corn-wheat spread breakouts
- 1998Be rich or be right: when only a written checklist counts as a system
- 1998Seasonal stock-index windows beyond the January effect
- 1999Same-maturity quality sleeves from a credit tunnel
- 2002Intraday sector pairs hedged as one spread
- 2006Seasonal regimes versus one-off news in commodity and rate spreads
- 2006Calendar spreads as an unknown-fundamentals regime filter
- 2008Placing early 2008 grain futures on a historical range map
- 2017Quiet tape as a construction window for multi-leg energy spreads