1987issue C111-4
Calendar gates for outright seasonal portfolios
Editorial view: treat the seasonal calendar as a permission gate, not a forecast. The same quarter-month window and seasonal history printout used on commodity-spread-trading were applied unchanged to outright contracts, then stacked into a seasonal portfolio so unused months stay idle by design.
- The procedure isolates a limited calendar window that historically combined a sizable average move with year-after-year recurrence, then leaves that market unused outside the focused period unless another seasonal is identified.
- Quarter-month seasonal trade analysis and a seasonal history printout, first used on spread seasonals, were applied unchanged to outright commodity contracts.
- A completed seasonal slot names the market, the dates, the expected direction and extent of the move, the contract month that best expresses it, and a stop-loss that ends the idea.
- A seasonal portfolio stacks accepted windows by trade count and peak margin so funds stay allocated across the year and off-window trades need not be chased.
A calendar window as a permission to trade
Seasonal-trading is a calendar-window procedure that treats entry, exit and abstention as one testable routine for a named contract. Editorial view: the calendar is not being asked to forecast the year. It is being asked only whether a named contract has earned a seat inside a historically recurring window.
Once that seat is granted, the same idea still has to name an exit and a stop-loss. Outside the accepted dates the contract is left unused unless another window is found.
The same tools on outright contracts
The same two tools used on spread seasonals, quarter-month seasonal trade analysis and a seasonal history printout, were applied unchanged to outright commodity contracts.
Commodity-spread-trading is a paired-leg seasonal workflow whose windowing tools, history listing and stop logic are reused without change on single-contract trades. The quarter-month window is a start-date by exit-date matrix used to isolate one accepted calendar cell for a specified contract month. The seasonal history printout is a year-by-year listing of that isolated window, used to judge consistency and to set the abort.
How a focused period is chosen
The procedure searches for a limited calendar window that has historically combined a sizable average move with year-after-year recurrence, then leaves that market unused outside the window unless another seasonal is identified. That accepted calendar interval is the focused period.
Named candidate windows include winter heating oil, summer gasoline, crop pre-harvest rises and post-harvest declines, spring Treasury-bill strength around tax-payment season, year-end currency effects from foreign-earnings repatriation, and a mid-year lumber decline.
The March corn case
The worked case is March corn over the 19 years from 1969 through 1987. The quarter-month matrix isolates 7 November through 28 February on that contract as a declining-price window.
The case listing singles out 1973 as a large contra-seasonal outcome and 1974 as a large following-year move in the seasonal direction, presenting that sequence as a recurring seasonal pattern. A contra-seasonal year is a year in which the isolated window moved against the historical direction, sometimes followed by an outsized year back in that direction.
March corn average price through the winter window
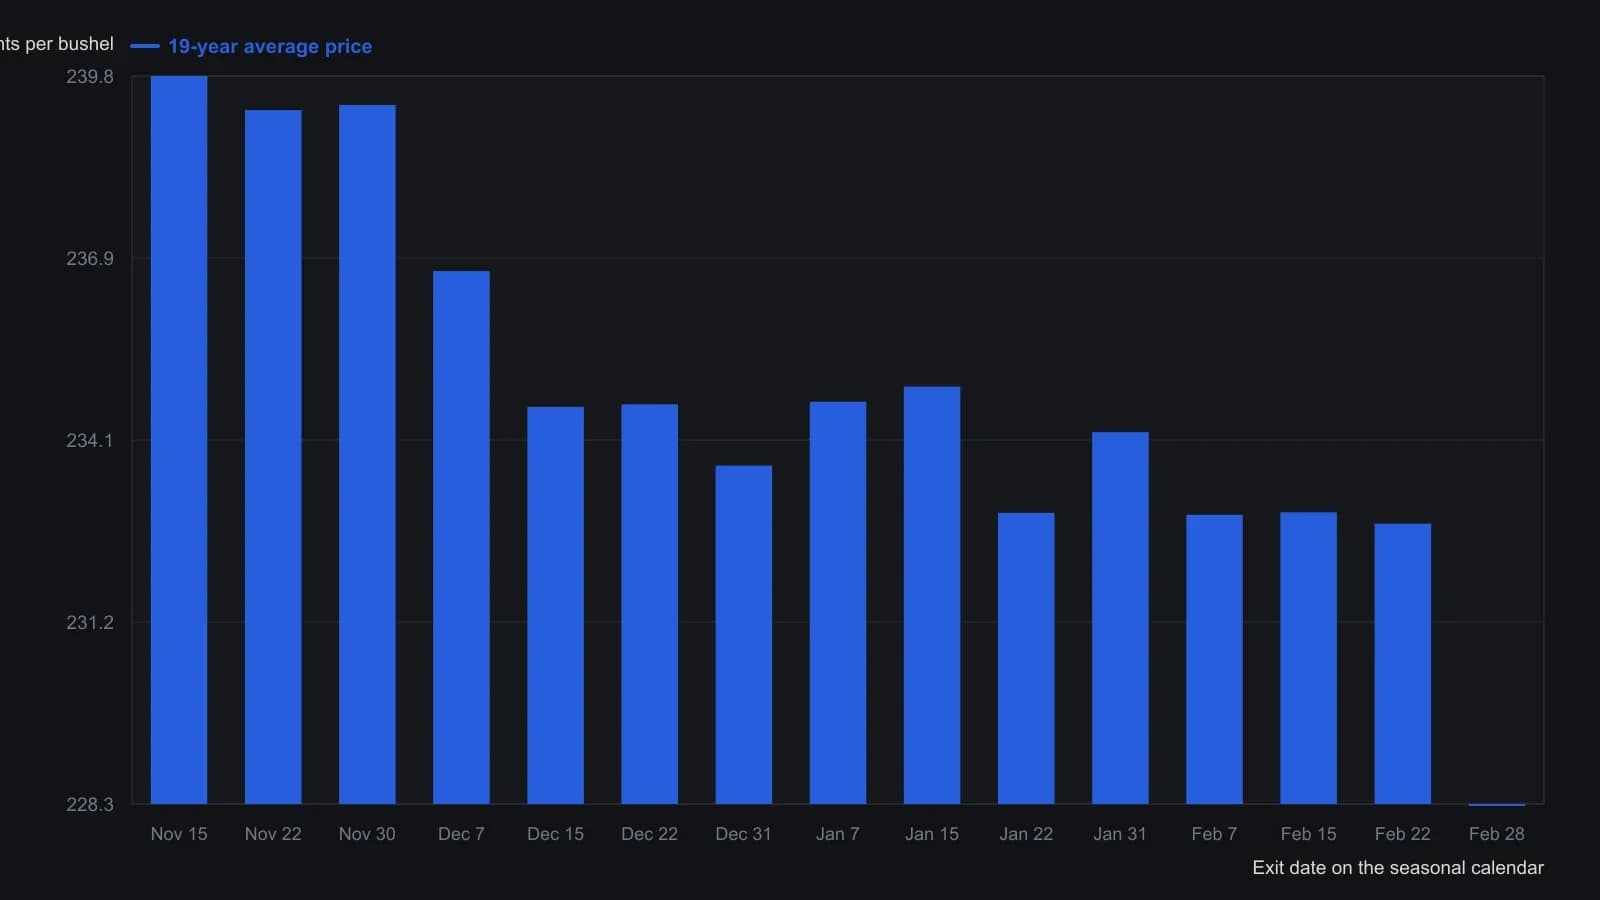
Sample is March corn, 1969–1987. November 22 is hard to read on the scan (it can look like 230.29). The companion contract-value row is $11,964, which is 239.28 cents at $50 per cent, and the neighboring dates sit at 239.83 and 239.37, so 239.29 is the value carried. Only the printed exit dates are used; the magazine’s price graph continues a few days before and after this set.
What a completed slot names
A completed seasonal slot is described as naming the market, the dates, the expected direction and extent of the move, the contract month that best expresses it, and a stop level that ends the idea.
After the 19 March-corn window trades were inspected, a stop of $1,100 was specified as the bound on that idea. Stop-loss is a precommitted abort that bounds a seasonal idea before entry and through the holding period.
A filter on top of the calendar
An independent trading method can be layered on the seasonal calendar as an extra filter, in the same way filters were already applied to spread trades. The calendar still decides whether the contract has a seat. The extra method only decides whether that seat is taken.
Why unused months stay idle
A diversified stack of seasonal windows is the stated reason a single commodity can sit idle in non-focused periods: other calendar slots keep funds allocated so off-window trades need not be chased. A seasonal portfolio is that diversified stack of accepted windows, sized by trade count and peak margin, so funds stay allocated across the year.
Editorial view: unused months are idle by design. The book is kept occupied by many gated slots, not by forcing a trade in a market whose focused period has closed.
Three books from quarter-month sheets
Quarter-month sheets were used to assemble three books: more than 250 trades with a $60,000 peak margin need; more than 100 trades needing $30,000; and just over 70 trades in nine commodities needing $15,000.
The small book is gold, bonds, lumber, heating oil, pork bellies, soybeans, wheat, sugar and the Deutschemark. The medium book adds coffee and the S&P 500.
All readings on this track · 17 readings
- 1987Seasonal commodity spreads as portfolio slots
- 1987Underwriting a seasonal livestock calendar spread
- 1987Calendar gates for outright seasonal portfolios
- 1988Relative strength spreads against a commodity index
- 1989Evaluating mechanical seasonal date rules for commodity spreads
- 1991Regime gates for intermarket and spread trades
- 1997A decision-logic filter for the July-November soybean spread
- 1997Seasonal wheat and corn spread windows
- 1997Seasonal filters for corn-wheat spread breakouts
- 1998Be rich or be right: when only a written checklist counts as a system
- 1998Seasonal stock-index windows beyond the January effect
- 1999Same-maturity quality sleeves from a credit tunnel
- 2002Intraday sector pairs hedged as one spread
- 2006Seasonal regimes versus one-off news in commodity and rate spreads
- 2006Calendar spreads as an unknown-fundamentals regime filter
- 2008Placing early 2008 grain futures on a historical range map
- 2017Quiet tape as a construction window for multi-leg energy spreads