1994issue C061-12
Evaluating system changes with chi-square, Sharpe, and leverage
A historical workflow ranks every trade for a chi-square lookup, scores monthly path comfort with a Sharpe ratio, and walks a contract-factor grid until a margin floor ends the size experiment.
- All trades are ranked from smallest to largest, the ranks are summed by system, and those sums become an H statistic that is read from a chi-square table.
- Systems need not share a trade count if the smallest group has at least five trades, and degrees of freedom equal the number of systems minus one.
- The Sharpe ratio subtracts a monthly risk-free rate from average monthly return and divides by the standard deviation of monthly returns, so a smoother path can outrank a higher-profit path.
- After a profitable screen, contract count is scaled from a 5,000 starting equity against a 2,000 margin floor; on the bond-size grid, 0.90 finished at 8,994 while 1.30 and larger drove equity through that floor.
Three gates for a parameter change
As an editorial framing, TradersWeek treats every parameter change as a hypothesis that must clear three evaluation gates: a chi-square test that the new trade ranks are not a chance reshuffle, a Sharpe ranking that the monthly path is more comfortable after a risk-free adjustment, and a leverage-control grid that refuses any size that would have hit the margin floor.
The archive workflow ranks trades, converts rank sums into an H statistic, scores monthly excess return, and scales contract count from a starting equity. The three-gate hypothesis reading is editorial and is not part of that workflow.
Rank trades and read an H statistic
A multi-system comparison ranks all trades from smallest to largest, sums those ranks by system, and converts the sums into an H statistic whose significance is read from a chi-square table. In this usage, a chi-square test is a table lookup that converts a rank-based H statistic and degrees of freedom into a confidence reading that several trade samples differ by more than chance.
Systems need not have the same trade count, so a short-interval sample and a longer-interval sample can be compared on the same data window if the smallest group has at least five trades before the chi-square lookup.
Degrees of freedom equal the number of systems minus one. With three systems that is two, and a 95 percent reading on that row corresponds to an H of 5.991. The worked three-system H landed between the 90 percent and 95 percent chi-square cutoffs. Ninety percent is presented as a practical trading threshold, with a longer backtest as the follow-up if doubt remains.
Score monthly path comfort
The Sharpe ratio subtracts a monthly risk-free rate from average monthly return and divides by the standard deviation of monthly returns. That is average monthly excess return divided by the standard deviation of monthly returns, used to rank systems by path comfort rather than raw profit.
Standard deviation counts both upside and downside swings, so a smoother monthly path can outrank a higher-profit path on this measure. Three months of returns is described as too short for a firm comparison.
Walk a size grid to the margin floor
After a system is screened as profitable, contract count is scaled from a starting equity illustrated at 5,000, subject to a 2,000 margin floor that ends the size experiment if breached. Leverage control, in this workflow, is a size grid that multiplies each historical trade by a contract factor and stops at the largest factor that never drives equity through a margin floor. That floor is the ruin threshold: the equity level at which a margin requirement is breached and the size experiment is treated as finished.
On the bond-size grid, a 0.90 contract factor finished at 8,994, while 1.30 and larger drove equity below the 2,000 floor. Any size above the peak of the size-versus-equity curve produced ruin.
A higher Sharpe reading is offered as a rule of thumb for allowing more leverage, while a smaller contract factor is described as trading short-term profit for survival through drawdowns.
Ending equity versus contracts per $5,000
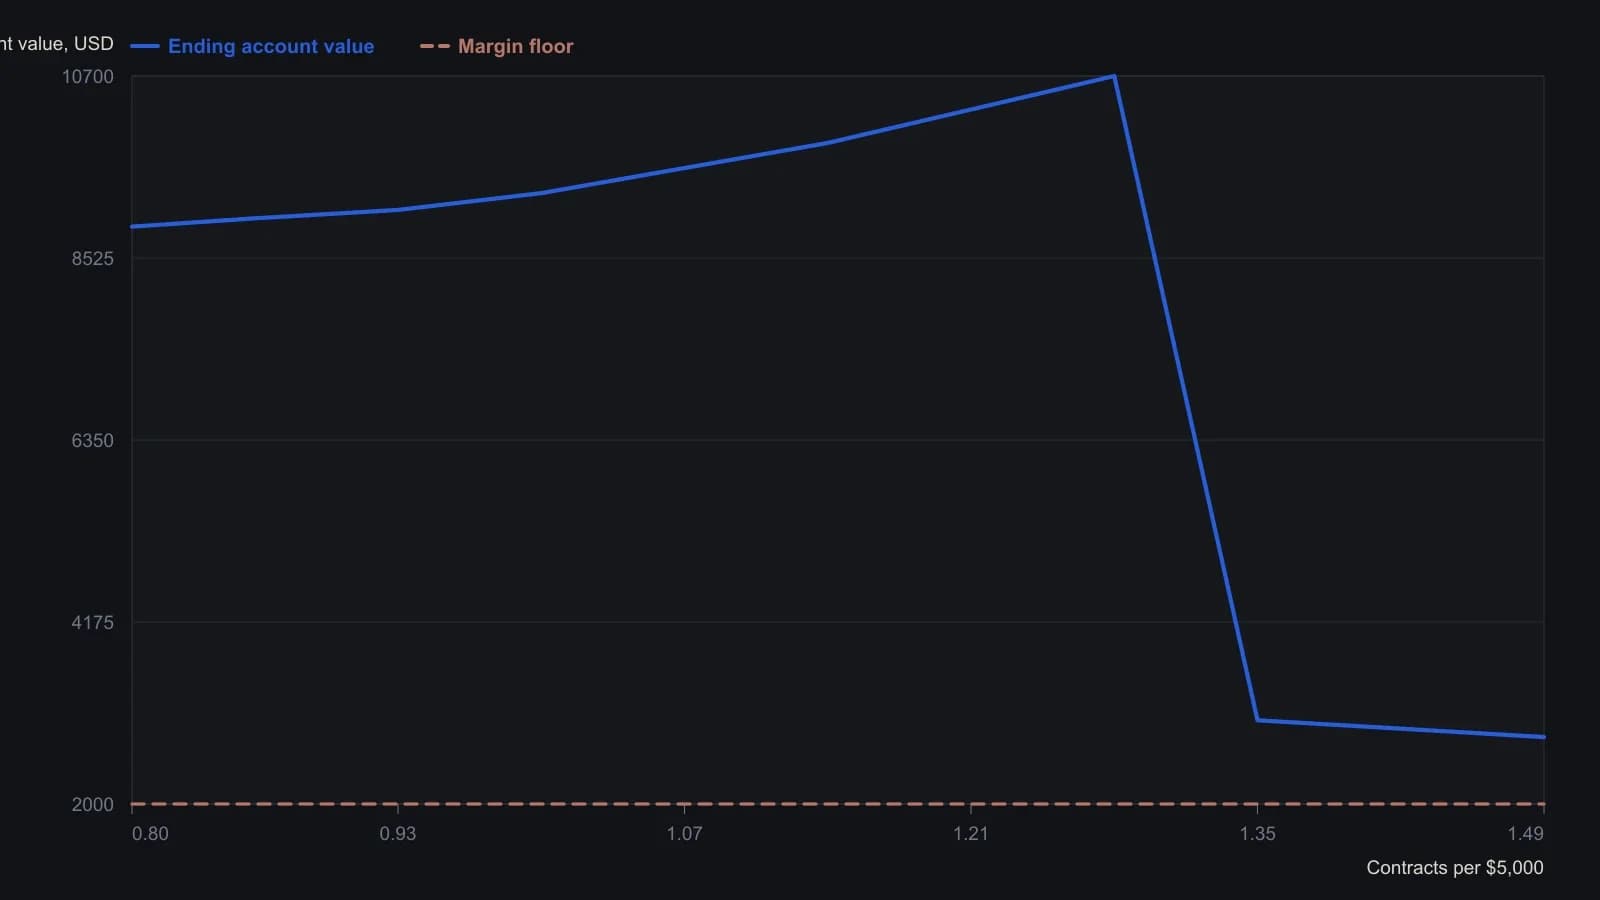
Hypothetical bond system, $5,000 start, $2,000 margin stop. The article states a 0.90-contract run finishes at $8,994 and that 1.30 contracts and higher go broke. Y values are approximate reads from a coarse inverted raster, so they are rounded to hundreds.
All readings on this track · 12 readings
- 1986Auditing stochastic crossovers with moving-average baselines
- 1994Evaluating system changes with chi-square, Sharpe, and leverage
- 1995Evaluating mechanical switch rules with a stop-loss order and Sharpe ratio
- 1995Intermediate-term allocation with drawdown filters
- 1996Evaluating a multi-market book without picking winners
- 1996Regime-aware allocation beyond a single equity trend
- 1997Evaluating managed futures as portfolio diversifiers
- 2008Audit an out-of-the-money covered-call overlay against a Sharpe control
- 2013Constructing the Sharpe ratio as return over variability
- 2014Expected value and bet size are separate controls
- 2015Constructing a Sharpe-style score from profit and loss variability
- 2019Continuous futures series and long-horizon allocation evaluation