1996issue C041-4
Evaluating a multi-market book without picking winners
After a mechanical entry, exit and size rule is frozen, a market is judged by how weakly its results move with the rest of the book, not by whether it led the sample. A correlation-aware mix can be scored against the best standalone series on Sharpe-style metrics.
- Two equal-weight holdings with the same average return, the same standalone volatility and zero return correlation keep that average return while producing a lower combined volatility than either holding alone.
- When every name has a 20% standalone deviation, book risk stays at 20% at every name count if pairwise correlation is 1, and falls toward 0 as the name count grows if pairwise correlation is 0.
- The combined nine-market series recorded a K-ratio of 3.40 and a Sharpe ratio of 0.21, next to yen-only readings of 3.33 and 0.22, even though gold and silver were net losers and the mix did not use hindsight about which markets would lead.
- The write-up treats adding markets with low return correlation as the route to further risk reduction on K-ratio and Sharpe scores, and treats choosing only expected leaders as a step that gives up most of that reduction.
A book after the rule is frozen
The archive applies one mechanical rule across several markets and then reports book-level scores next to standalone series. Diversification is combining sleeves so that risk that is local to one market shrinks at book level when those sleeves do not move in lockstep, without requiring average return to rise.
Two holdings with zero correlation
Two equal-weight holdings with the same average return, the same standalone volatility, and zero return correlation keep that average return while producing a lower combined volatility than either holding alone. In the two-name illustration, a 10% average return and a 20% standalone deviation with zero correlation left average return at 10% and reduced combined deviation from 20% to 14%.
Pairwise links and book risk
Correlation analysis is measuring how periodic results of markets or sleeves move together, then using those links to judge how much independent risk remains after they are combined. Portfolio-standard-deviation is the book-level volatility that remains after pairwise links and the number of holdings are taken into account, as opposed to the standalone volatility of any one name.
A grid that holds every name at a 20% standalone deviation shows book risk stuck at 20% at every name count when pairwise correlation is 1, and falling toward 0 as the name count grows when pairwise correlation is 0. With zero pairwise correlation and a 20% standalone deviation, two names produced a 14.14% book deviation, ten names a 6.32% book deviation, and the infinite-count limit was 0%.
One breakout rule across markets
The futures illustration applied one 40-day high/low breakout and a 10-day opposite-side exit across markets, scaled each signal to a 10000-dollar initial risk so swings were more comparable, and deducted 100 dollars per trade for costs. Volatility-equalized-sizing is setting contract count from a fixed initial-dollar risk so that markets with different tick values and swings take more comparable risk per signal.
Sharpe ratio after the bill wash
Sharpe ratio is average periodic return, after any risk-free wash in a backtest that ignores margin interest, divided by the standard deviation of those periodic returns, used to compare books on return per unit of variability. When a historical test omitted interest on posted bills, the Sharpe calculation reduced to average monthly return divided by the standard deviation of monthly returns, because adding and then subtracting the bill rate cancelled.
Worked K-ratio equity path from the Excel sheet
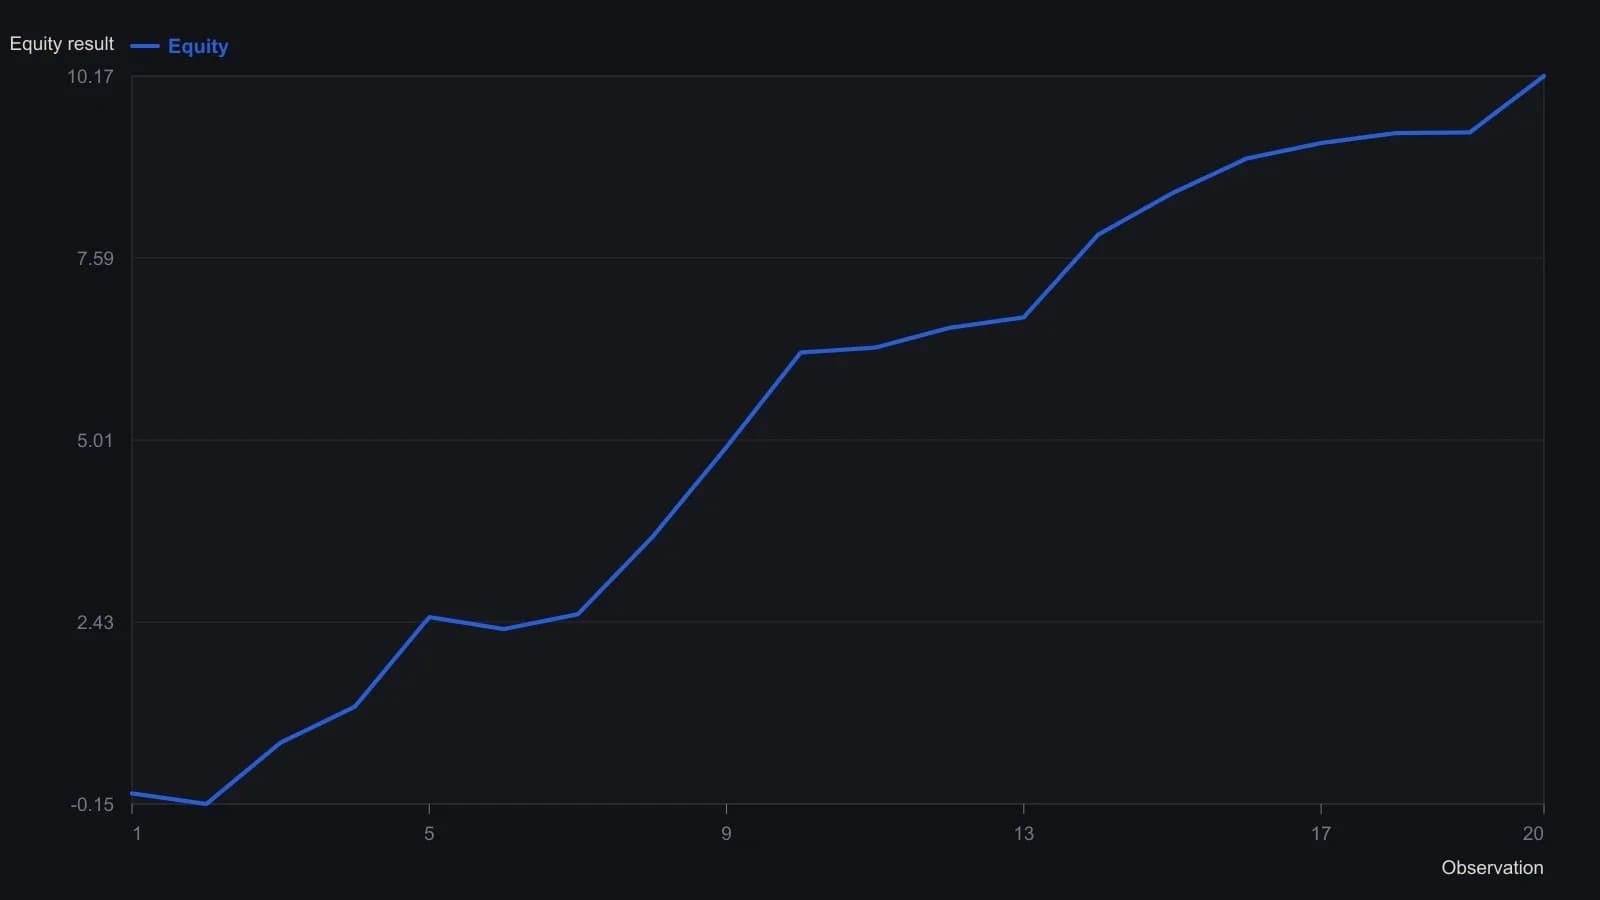
This is a 20-point worksheet example, not a live market track. Kestner models equity as b0 + b1 x; the published K-ratio 5.90 is the sheet's scalar output, not a plotted series.
Nine markets next to the yen series
K-ratio is a consistency score that divides the slope of a linear fit through equity by the standard error of that slope and by the square root of the observation count. On the January 1985 through July 1993 sample, the yen series posted the highest K-ratio and Sharpe ratio among the nine markets, while gold and silver posted the lowest readings on both measures.
The combined nine-market series recorded a K-ratio of 3.40 and a Sharpe ratio of 0.21, next to yen-only readings of 3.33 and 0.22, even though gold and silver were net losers on the same rule and the mix did not use hindsight about which markets would lead.
Low correlation versus expected leaders
Monthly-return links among the nine series were often positive, including a 0.77 reading between the Deutschemark and Swiss franc series, so the book was not a zero-correlation set. The write-up treats adding markets with low return correlation as the route to further risk reduction on K-ratio and Sharpe scores, and treats choosing only expected leaders as a step that gives up most of that reduction.
All readings on this track · 12 readings
- 1986Auditing stochastic crossovers with moving-average baselines
- 1994Evaluating system changes with chi-square, Sharpe, and leverage
- 1995Evaluating mechanical switch rules with a stop-loss order and Sharpe ratio
- 1995Intermediate-term allocation with drawdown filters
- 1996Evaluating a multi-market book without picking winners
- 1996Regime-aware allocation beyond a single equity trend
- 1997Evaluating managed futures as portfolio diversifiers
- 2008Audit an out-of-the-money covered-call overlay against a Sharpe control
- 2013Constructing the Sharpe ratio as return over variability
- 2014Expected value and bet size are separate controls
- 2015Constructing a Sharpe-style score from profit and loss variability
- 2019Continuous futures series and long-horizon allocation evaluation