1989issue C021-3
Odd-lot short interest as a constructed breadth series
Odd-lot shorts are scaled to two-way odd-lot volume, separated by professional and public participation, and smoothed with a 33 percent weekly exponential average. Editorial reading: the result is a breadth series whose chart extremes can be tested as demand-and-regime hypotheses, not as a raw pessimism count.
- Short interest is the open amount of borrowed-share sales that still requires a later purchase to return the stock.
- A large open short interest is treated as latent covering demand, not as a simple count of bearish opinion.
- The odd-lot short percentage scales odd-lot shorts to the two-sided average of odd-lot purchases and sales, then a weekly 33 percent exponential average smooths the erratic daily prints.
- A high professional-public mix is constructed as a cautionary participant-regime reading even when total short interest is large.
Short interest as stored demand
Short interest is the open amount of stock sold after borrowing. The position stays open until a purchase returns the shares.
A large open short interest is treated as stored future demand rather than as a simple count of bearish opinion, because covering purchases remain to be made. That implied later buying is latent covering demand.
How the odd-lot short percentage is built
An odd-lot short is a short sale executed in a parcel smaller than 100 shares.
The odd-lot short percentage equals 200 times odd-lot shorts divided by the sum of odd-lot purchases and sales, which is the same as 100 times shorts divided by the average of those two sides. The construction therefore scales shorts to two-sided odd-lot activity.
Daily prints and the weekly series
Odd-lot shorts are reported daily with a one-day delay and weekly with a two-week delay.
Daily odd-lot short percentages are treated as erratic, so they are combined into a weekly series or taken from the delayed weekly print.
The professional-public mix
A high ratio of professional short sales to public short sales is constructed as a cautionary participant-regime reading even when total short interest is large. The professional-public mix is that relative size, used as a participant-regime filter rather than as another total.
The stated exponential average
A 33 percent exponential average of the weekly odd-lot short percentage is the stated smoother applied to the constructed series. An exponential average is a recursive weekly smoother that assigns a stated weight to the newest observation.
Where the mid-1980s sample sat
The mid-1980s sample of the series stayed below its median through 1983 and 1984 and later averaged higher after professionals used the odd-lot channel more often.
The constructed series sat in its lower quartile before 19 October 1987 and, after a subsequent rise, occupied its upper quartile from March 1988.
Odd-lot short percentage, 1982–1988, with quartile bands
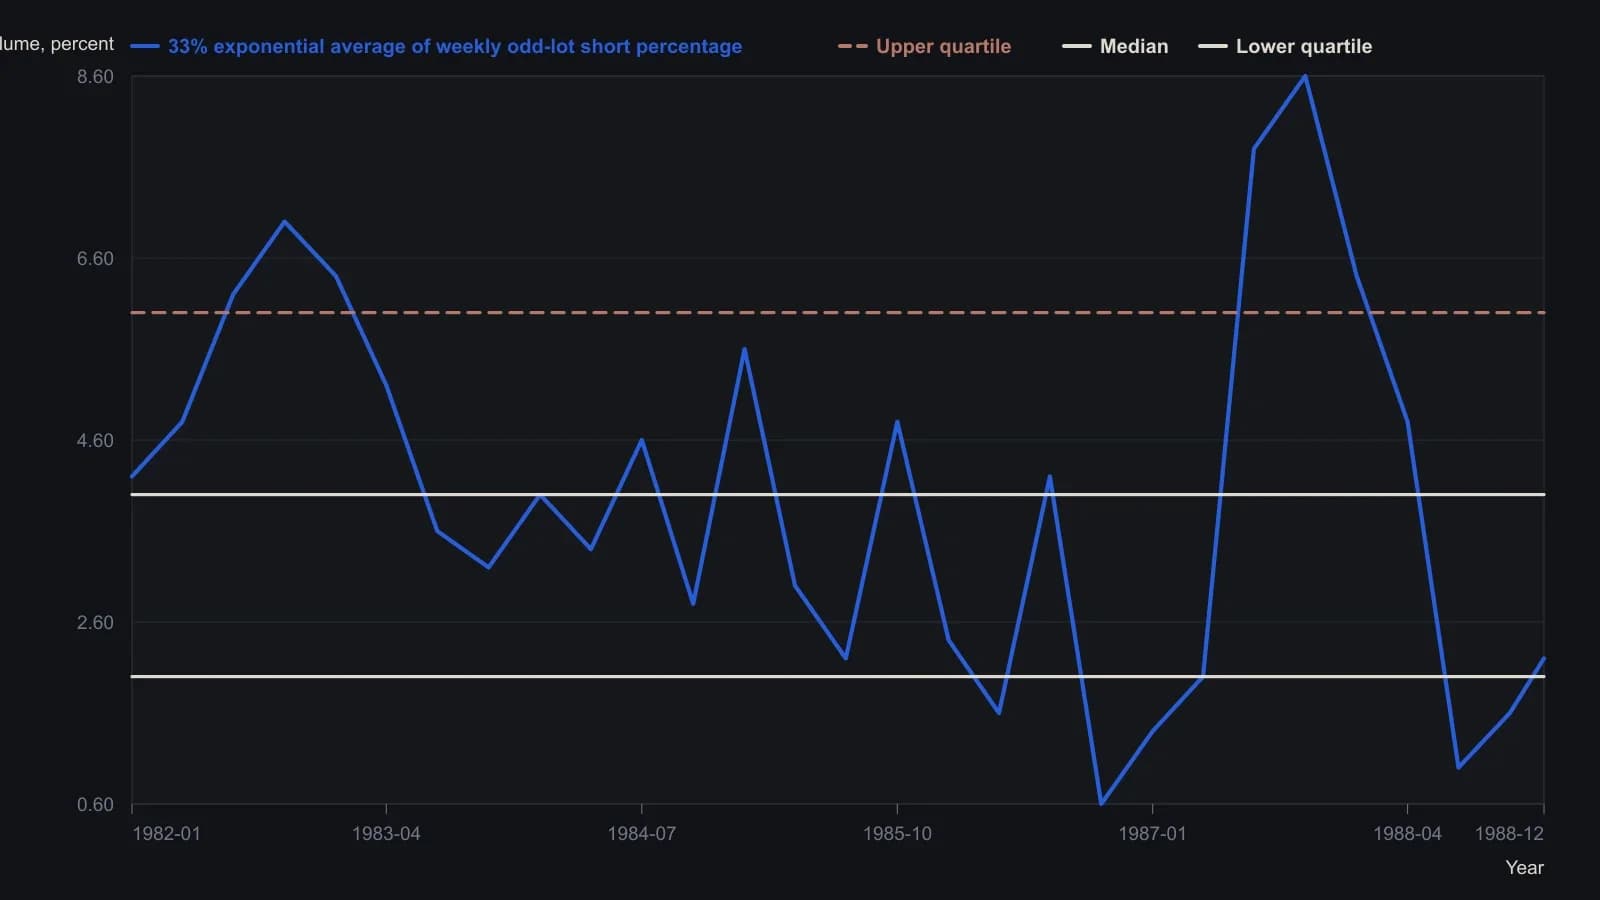
Merrill states the weekly series is a 33 percent exponential average of odd-lot shorts scaled as 200 × shorts ÷ (purchases + sales). Quartile and median lines are those drawn on the source chart. Digitized points are approximate; the raster does not support more precision than about 0.2–0.3 percentage points.
All readings on this track · 21 readings
- 1988Classifying primary futures for regime-aware trades
- 1989Odd-lot short interest as a constructed breadth series
- 1989Volume-scaled member versus public short sales as a two-class classroom test
- 1989Evaluating public versus member short-sale breadth
- 1989Lock smoothing inside each short-share before the breadth ratio
- 1989Headline intensity as a three-horizon contrarian filter
- 1989Evaluating technical-fund open interest and daily volatility
- 1990Constructing fund cash and manager-preference filters
- 1990Stock-style futures rules miss index-spread drivers
- 1991Constructing short-squeeze pain from interest and margin
- 1995Contrary sentiment and put-call premiums around large Dow swings
- 1995Act on a pattern change, not on formula signals
- 2002Single-stock futures: contract selection and the margin box
- 2003A crowd fade needs an insider-pattern divergence gate
- 2005A quiet insider tape as a seasonal regime case
- 2006Unwritten pit cues need testable rules
- 2010A gold corrective-phase case after the 1265 high
- 2014Ticket charges, margin carry, and bank liquidity limits
- 2014A liquidity filter for majors, crosses, and exotics
- 2017Test a high-low forecast as one procedure, then cut the book
- 2020Follow or fade as one trading procedure