1989issue C101-7
Headline intensity as a three-horizon contrarian filter
Public market storytelling becomes one procedure when each piece is first matched to the crowd's clock. Language-extremity, coverage-silence, and a participation-cluster then decide whether a position is opened, held, faded, or skipped, so a single trade sits inside a sentiment regime rather than fighting a lone overbought reading.
- Tape families that use only price, volume, and open interest were described as clustering around a simple moving average, while monthly commercial hedging reports miss many interim moves and compiled contrary letters lag and stay mute on holding period.
- Headline-horizon matching assigns mass-circulation covers to multi-year turns, business weeklies to the next quarter, and daily pages to short-term extremes before any fade is considered.
- Language-extremity, a participation-cluster of three or four inviting stories, and coverage-silence on an unmentioned decline were used to choose open, hold, fade, or skip rather than to add risk into a crowd.
- Framing-override reads mixed or misdirected wording as a short-term range, a handoff, or an intact longer regime, so one featured market is placed inside a sentiment setting instead of being faded from a single overbought label.
Why tape and letter scores still need a clock
Tape-based technical families were described as converging on results similar to a simple moving average because few of them use inputs beyond price, volume, and open interest. Monthly commercial hedging-position reports were presented as a useful smart-flow input that still misses many interim moves because of their publication cadence.
Compiled market-letter contrary opinion was characterized as lagging by about a week, vulnerable to long overbought or oversold stretches, and silent on whether a fade is a scalp or a position trade. Editorial reading: those inputs can flag heat, yet they do not attach a story to the crowd's clock, so they cannot by themselves say whether to open, hold, fade, or skip.
Sort stories by headline-horizon
A three-horizon media procedure mapped mass-circulation cover stories to multi-year turning points, business weeklies to the next quarter, and daily business pages to short-term extremes. That mapping is the headline-horizon sort. Editorial comment: the same verb changes meaning once the clock is fixed, so a daily panic is not treated as a multi-year verdict.
Language, clusters, and coverage-silence
On the daily commodity page, extreme movement verbs were treated as near-term exhaustion markers, while milder continuation verbs were treated as unfinished-trend language. That contrast is language-extremity: panic or superlative wording treats a move as already decided, and milder wording treats the same move as still unfolding.
Three or four participation-inviting stories on the same market within a few weeks were interpreted as a crowding warning at a top or bottom rather than a reason to add risk. A participation-cluster is that tight run of encouraging, non-panic stories. A few such pieces can mark an unfinished trend, while several in a few weeks can mark crowding.
When the featured commodity page ignored a violently declining stock and bond market in favor of other products, that silence was read as evidence the unmentioned decline was unfinished. Coverage-silence is that absence on the featured page.
1987 crude oil around Wall Street Journal headline clusters
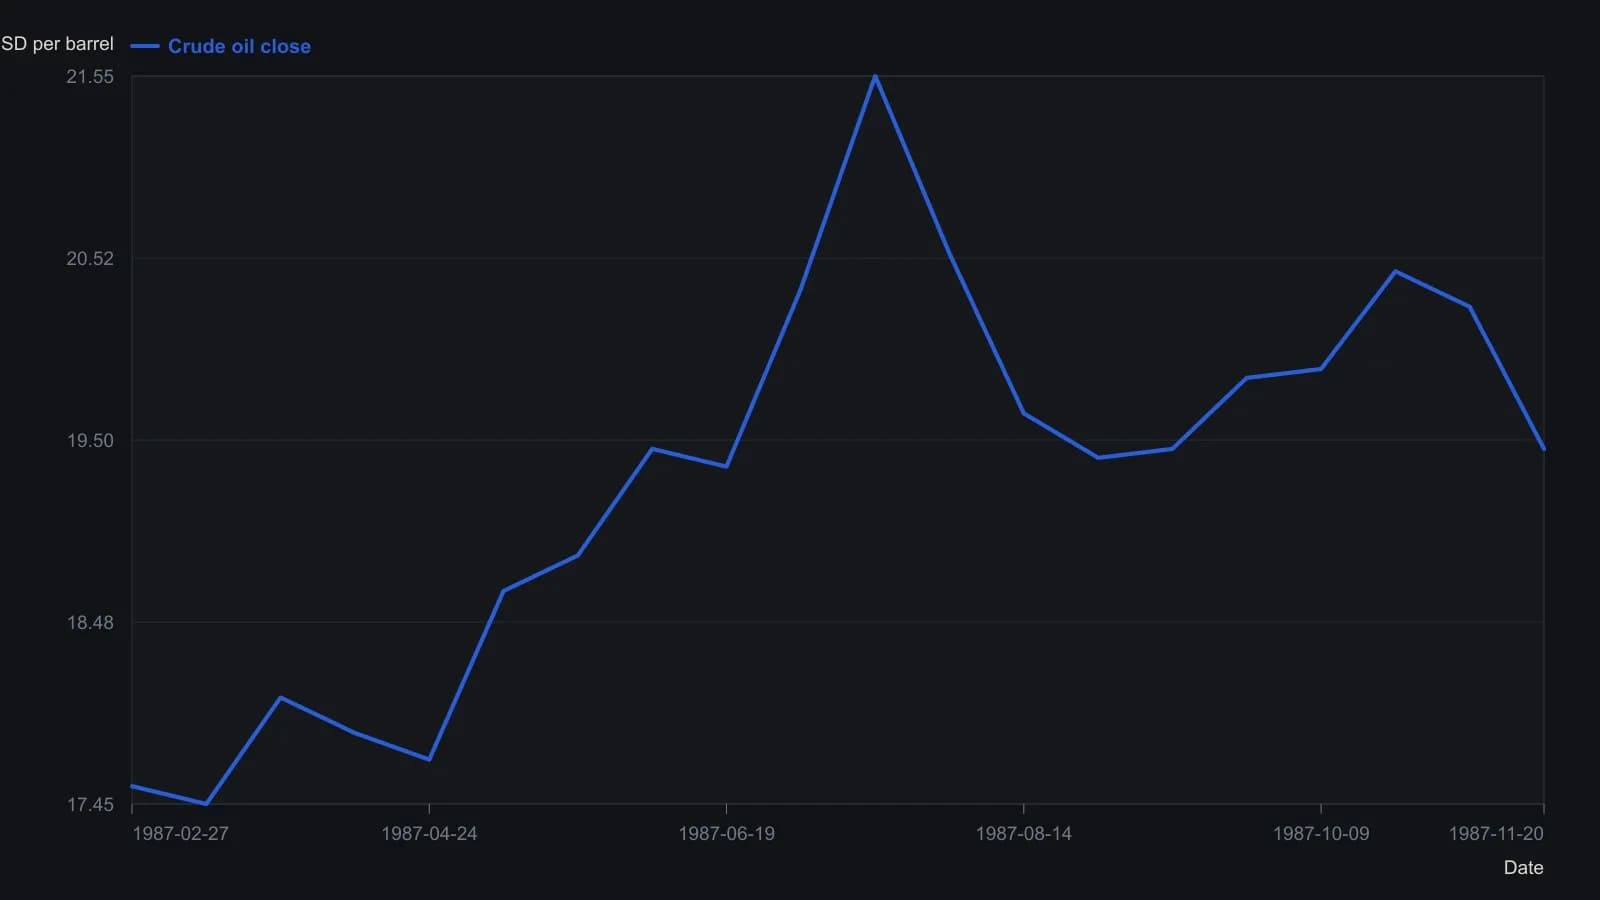
Source is an OHLC bar chart, not a tabulated series. Points are approximate closes at the printed date ticks; intra-bar extremes such as the mid-August spike to about 18.10 are omitted so the series stays under the digitizing cap.
Framing-override across adjacent stories
A single-market feature with charts and expert targets was treated as a setup for a major countermove. A copper-surge feature was followed by an immediate decline and a crash-week plunge, after which the same commentary flipped to depression-level downside even as prices later made new highs.
Mixed wording that paired instability with stronger demand was decoded as a short-term range inside an intact longer trend, so adjacent energy headlines were interpreted together rather than faded one by one. Drought coverage framed as a slow inflation scare rather than crop panic was associated with a peak in the inflation-metal trade, while later panic crop language was associated with the grain top.
Editorial reading: framing-override is the step that reads a story's target and tone together, so mixed or misdirected wording is decoded as a short-term range, a handoff between assets, or a longer regime that is still intact. The aim is to seat one trade inside that sentiment regime rather than to fight a lone overbought reading.
All readings on this track · 21 readings
- 1988Classifying primary futures for regime-aware trades
- 1989Odd-lot short interest as a constructed breadth series
- 1989Volume-scaled member versus public short sales as a two-class classroom test
- 1989Evaluating public versus member short-sale breadth
- 1989Lock smoothing inside each short-share before the breadth ratio
- 1989Headline intensity as a three-horizon contrarian filter
- 1989Evaluating technical-fund open interest and daily volatility
- 1990Constructing fund cash and manager-preference filters
- 1990Stock-style futures rules miss index-spread drivers
- 1991Constructing short-squeeze pain from interest and margin
- 1995Contrary sentiment and put-call premiums around large Dow swings
- 1995Act on a pattern change, not on formula signals
- 2002Single-stock futures: contract selection and the margin box
- 2003A crowd fade needs an insider-pattern divergence gate
- 2005A quiet insider tape as a seasonal regime case
- 2006Unwritten pit cues need testable rules
- 2010A gold corrective-phase case after the 1265 high
- 2014Ticket charges, margin carry, and bank liquidity limits
- 2014A liquidity filter for majors, crosses, and exotics
- 2017Test a high-low forecast as one procedure, then cut the book
- 2020Follow or fade as one trading procedure