1995issue C081-12
Act on a pattern change, not on formula signals
Listed options, futures and stock-to-futures basket arbitrage added mechanical, nonfundamental decisions that show up in volatility and swings. The archive workflow treated that force as part of the daily bar, kept entry, exit and standing aside on a few hand-tracked internals, and waited for a checkable change in who was forced to act.
- Treat derivative-linked swings as a real force on the daily bar, not as residue to strip away.
- Bind entry, exit and abstention to market state, execution constraints and a felt but checkable change in pattern.
- Keep the reading on hand-posted daily bars, a simple advance-decline oscillator and raw new-high and new-low counts rather than on a computer crossover.
- Place a single trade inside the constraints of specialists, institutions, consultants and fully invested house rules, including two-to-three-day tape rotation.
Mechanical flow belongs on the daily bar
Listed options, futures and stock-to-futures basket arbitrage changed how technicians read markets by adding mechanical, nonfundamental decisions that show up in volatility and swings.
What looks like noise after those instruments arrived was treated as a real market force to include in the reading, not a residue to strip from the daily bar.
The public share of transactions was recalled as about two thirds in an earlier exchange-floor period and later estimated at less than one third.
Who is forced to act
Institutional response to a toppy chart or a rating cut sped from a monthly meeting, to a weekly meeting, to waiting for a manager to return from lunch, to executing immediately without details.
House rules moved toward a fully invested or almost fully invested mandate, so selling one holding required buying another. Consultant reallocations enforced that constraint and were cited as one reason the tape rotated on a two-to-three-day horizon.
Same-session broadcast and desktop charts compressed reaction: put buying within 30 seconds of a drop and a correction-headline frame within two minutes.
Editorial reading: this is a regime of who is forced to act. Specialists, institutions, consultants and derivative-linked flows set the constraints a single trade has to sit inside.
A few hand-tracked internals
Hand-posted daily bars were treated as the least abstract, time-linked summary of the tape. Tick charts were too short-term, weeklies and point-and-figure more abstract, and computer oscillators such as a stochastic crossover above 80 were called seductive but too inconsistent to rely on.
A 10-day moving average of the advance-decline differential was kept as a simple overbought/oversold oscillator after 9-, 11- and 13-day windows were compared, and a 10-day versus 30-day cross was the only mechanical breadth rule retained.
Daily new-high and new-low counts were favored as a raw internal. Fewer new lows against a falling average were read as fading downside momentum, including around the June 1982 low and the 1990 low after the Kuwait invasion.
Editorial reading: those counts turn advance-decline, new-high and new-low participation, and price structure into a checkable hypothesis about whether a move is still intact. Standing aside stays inside the same procedure until that hypothesis changes.
10-day and 30-day averages of advances minus declines
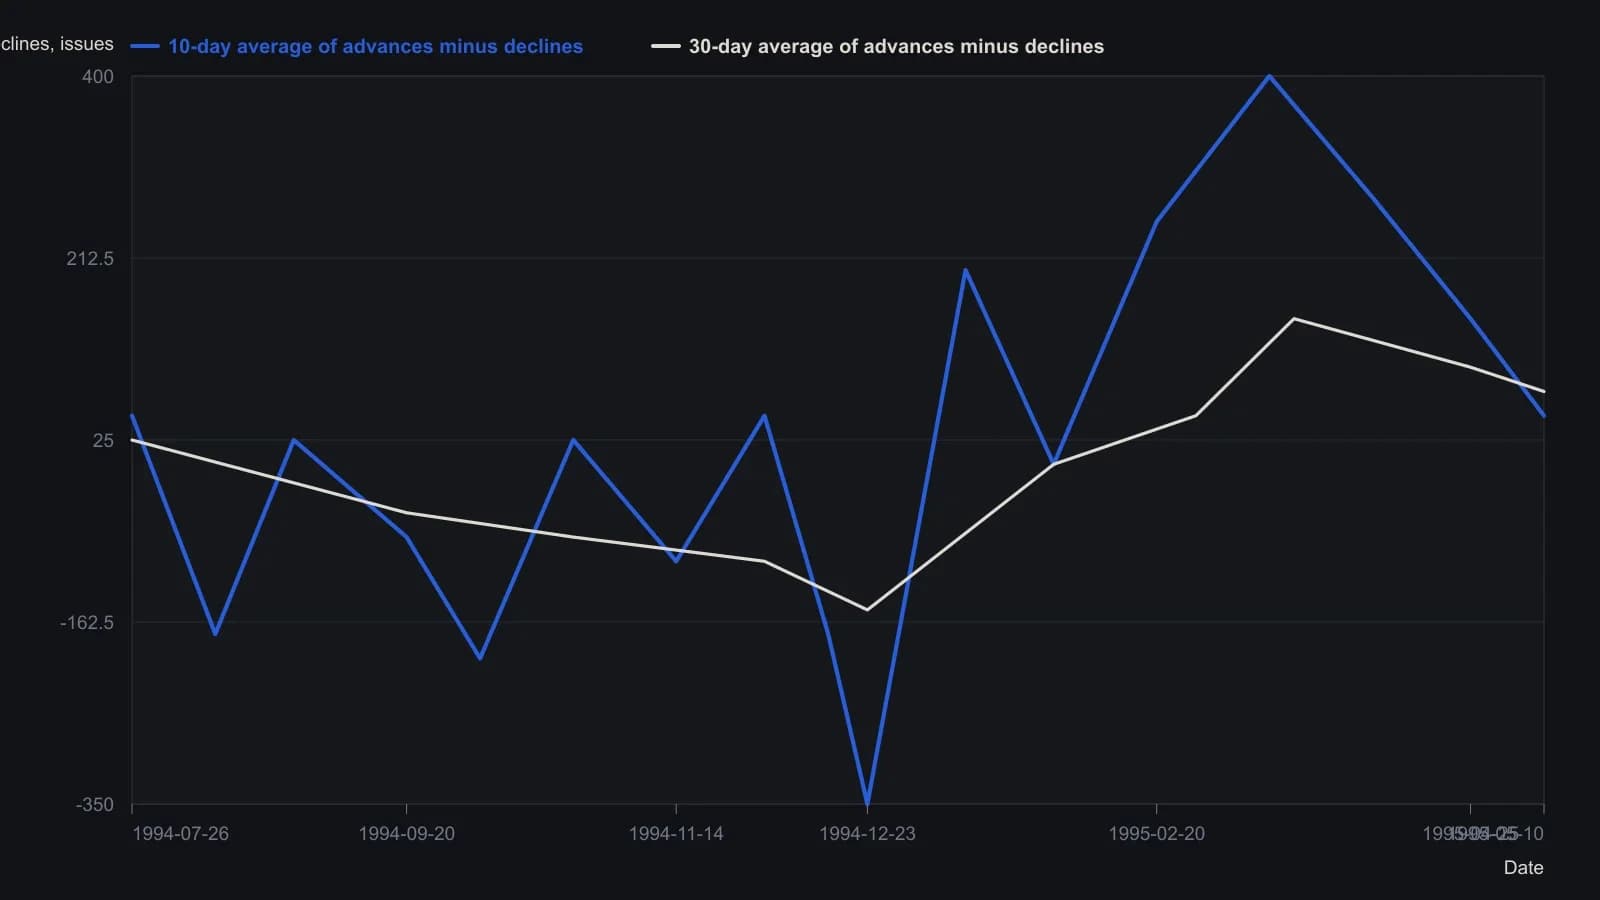
Mamis said he had tried nine-, 11- and 13-day spans and kept 10 days because the arithmetic stayed simple. Values are approximate readings from a scanned plot, not a published table; dates between the five printed ticks are interpolated along the time axis. Dual-scale S&P 500 price on the same figure is omitted so the y-axis stays in one unit.
A lagged forced-sale measure
Specialist short sales as a share of total shorts were read as a late-rally forced-sale measure, reported with a two-week lag. Contemporary bands were about 48-52% on the high side and 29-32% on the low side.
A recent 41 reading was not treated as late-cycle until a rise toward 44 or 45 or a rising trend against a still-rising market appeared.
Editorial close: entry, exit and abstention wait on a change in that participant pattern. A specialist share still at 41 is the same standing-aside case as an oscillator print that has not yet been joined by a change in who is forced to act.
All readings on this track · 21 readings
- 1988Classifying primary futures for regime-aware trades
- 1989Odd-lot short interest as a constructed breadth series
- 1989Volume-scaled member versus public short sales as a two-class classroom test
- 1989Evaluating public versus member short-sale breadth
- 1989Lock smoothing inside each short-share before the breadth ratio
- 1989Headline intensity as a three-horizon contrarian filter
- 1989Evaluating technical-fund open interest and daily volatility
- 1990Constructing fund cash and manager-preference filters
- 1990Stock-style futures rules miss index-spread drivers
- 1991Constructing short-squeeze pain from interest and margin
- 1995Contrary sentiment and put-call premiums around large Dow swings
- 1995Act on a pattern change, not on formula signals
- 2002Single-stock futures: contract selection and the margin box
- 2003A crowd fade needs an insider-pattern divergence gate
- 2005A quiet insider tape as a seasonal regime case
- 2006Unwritten pit cues need testable rules
- 2010A gold corrective-phase case after the 1265 high
- 2014Ticket charges, margin carry, and bank liquidity limits
- 2014A liquidity filter for majors, crosses, and exotics
- 2017Test a high-low forecast as one procedure, then cut the book
- 2020Follow or fade as one trading procedure