1995issue C021-15
Contrary sentiment and put-call premiums around large Dow swings
A large Dow swing is easier to place when weekly crowd tallies and the equity option-premium ratio are read together. The archive treated bullish and bearish shares as contrary, then asked whether listed-equity put premiums versus call premiums sat in the rally band, the decline band, or an extreme band that did not precede those declines.
- Weekly bullish and bearish shares were treated as contrary-sentiment readings, not as confirmation of the crowd outlook.
- Across advisory letters, individual investors, brokerage professionals, and periodical advisors, 150-point Dow rallies and declines began at historically separated bullish and bearish levels.
- The equity option-premium ratio showed no overlap between the band that preceded 150-point rallies and the band that preceded 150-point declines.
- The highest post-1988 bullish prints in each survey, and option-premium-ratio values from 1.17 to 1.74, were not followed by a 150-point decline, so a fade rule has to test those exclusions.
Place the swing before treating it as isolated
A large-djia-swing is a Dow Jones Industrial Average rally or decline of at least 150 points after a prior swing of at least 150 points in the opposite direction. The archive did not treat those turns as isolated index facts. It sat them next to weekly crowd tallies and next to the closing put-call-ratio, the closing ratio of listed-equity put premiums to call premiums.
Editorially, that pairing is a two-layer regime check. The first layer is market-participant-analysis: weekly tallies of advisory letters, individual investors, and brokerage professionals used to place one index swing in a crowd-and-regime context. The second layer asks whether the option-premium-ratio, the put-premium-to-call-premium reading across equity options on the listed options exchanges excluding index options, sits in a historically separated band.
Read bullish and bearish shares as contrary
Weekly bullish and bearish survey shares were treated as contrary-sentiment readings: a high bullish share or a low bearish share was viewed as unfavorable for further upside, and a low bullish share or a high bearish share as favorable for upside. Four weekly sentiment surveys had been running for at least seven years, with start years of 1969, 1982, 1983, and 1987.
Editorially, that is the start of a contrarian-strategy: treat crowded bullish or bearish survey shares as a potential fade, then test whether the most extreme bullish prints should be excluded from that fade rule.
Advisory letters at 150-point turns
In a weekly classification of about 120 advisory letters, 150-point Dow rallies after 150-point declines began near 35 percent bulls, with a mean of 35.5 percent and a median of 34.4 percent, and about 44 percent bears, with a mean of 43.5 percent and a median of 44.6 percent. Bears were typically about nine percentage points above bulls.
In that same advisory-letter survey, 150-point Dow declines after 150-point rallies, omitting October through December 1987, began near 49 percent bulls, with a mean of 49.2 percent and a median of 48.4 percent, and about 30 percent bears, with a mean of 29.4 percent and a median of 30.0 percent. Bulls were about 19 percentage points above bears.
Investors, brokerage desks, and periodical advisors
In a large individual-investor postcard survey, those 150-point rallies typically began at 28 percent bulls, the mean and the median, and about 35 percent bears, with a mean of 36 percent and a median of 33 percent. Those declines began near 36 percent bulls and about 29 percent bears.
In a Monday poll of about 100 brokerage-house professionals, weekly bullish shares averaged about 40 percent before 150-point rallies, with a mean of 38 percent and a median of 41 percent, and about 56 percent before 150-point declines, with a mean of 55 percent and a median of 56 percent.
In a Monday tabulation of advisor views published in newspapers and periodicals rather than market letters, bullish shares averaged about 25 percent before 150-point rallies, with a mean of 26 percent and a median of 23 percent, and about 52 percent before 150-point declines, with a mean of 51 percent and a median of 52 percent.
AAII bull, bear and correction shares at 150-point Dow rally starts
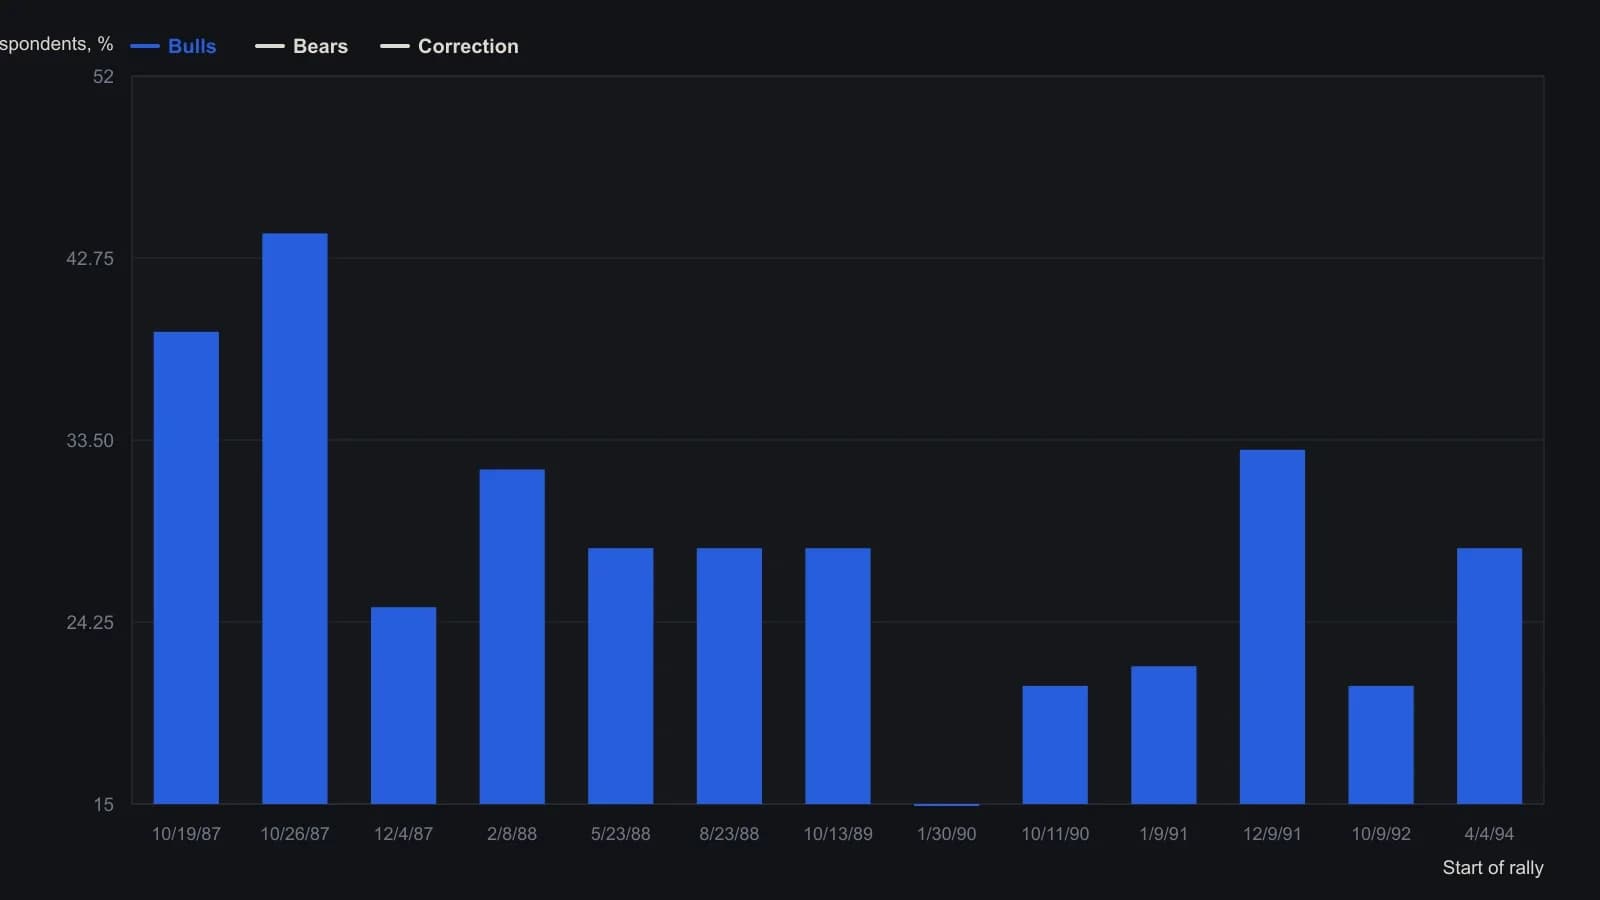
The source table uses the Barron's AAII print for each rally start, not a continuous weekly series. The third column is headed Correction; the AAII survey wording for that residual share is neutral. Mean bulls 28 percent, mean bears 36 percent.
The option-premium ratio did not overlap
The closing equity-option put-premium-to-call-premium ratio, excluding index options, ranged from 0.03 to 0.51 before 150-point rallies and from 0.70 to 1.16 before 150-point declines, with no overlap. The means were 0.35 versus 0.88 and the medians 0.37 versus 0.84.
Editorially, that separation is why the put-call-ratio is used here as a market-regime reading rather than as a standalone entry trigger. The rally band, the decline band, and the more extreme values sit in different ranges.
Record optimism did not mark those declines
After 1988, the highest bullish readings in each of the four surveys were not followed by a 150-point decline. Advisory bulls were above 54.0 percent on 10 weeks, individual-investor bulls were above 41 percent on 74 weeks, professional bulls were above 60 percent on 7 weeks, and periodical-advisor bulls were above 61 percent on 22 weeks. Option-premium-ratio values from 1.17 to 1.74 likewise were not followed by such a decline.
Editorially, a contrarian-strategy that fades every crowded bullish print has to test an exclusion for those extremes. Record optimism was not, in this historical workflow, the setup that preceded the classified 150-point declines.
A single weekly print is not the whole input
Survey percentages were treated as only one input. Multi-week persistence, one- and two-week jumps in bullish or bearish shares, and how those shares moved with the Dow were described as at least as important.
Editorially, the testable procedure is the full sequence rather than a single weekly percentage: crowd location, option-premium-ratio band, then persistence and co-movement with the Dow.
All readings on this track · 21 readings
- 1988Classifying primary futures for regime-aware trades
- 1989Odd-lot short interest as a constructed breadth series
- 1989Volume-scaled member versus public short sales as a two-class classroom test
- 1989Evaluating public versus member short-sale breadth
- 1989Lock smoothing inside each short-share before the breadth ratio
- 1989Headline intensity as a three-horizon contrarian filter
- 1989Evaluating technical-fund open interest and daily volatility
- 1990Constructing fund cash and manager-preference filters
- 1990Stock-style futures rules miss index-spread drivers
- 1991Constructing short-squeeze pain from interest and margin
- 1995Contrary sentiment and put-call premiums around large Dow swings
- 1995Act on a pattern change, not on formula signals
- 2002Single-stock futures: contract selection and the margin box
- 2003A crowd fade needs an insider-pattern divergence gate
- 2005A quiet insider tape as a seasonal regime case
- 2006Unwritten pit cues need testable rules
- 2010A gold corrective-phase case after the 1265 high
- 2014Ticket charges, margin carry, and bank liquidity limits
- 2014A liquidity filter for majors, crosses, and exotics
- 2017Test a high-low forecast as one procedure, then cut the book
- 2020Follow or fade as one trading procedure