2002issue C071-4
From the power spectrum to indicator windows
Editorial reading: treat a fast Fourier transform as a construction bench for cycle-aware lookbacks. Detrend, taper, and pad first, then convert the tallest spectral peak into an explicit indicator window.
- Fourier analysis reconstructs a complex series as sinusoids of amplitude, frequency, and phase, and spectral analysis uses that same construction to identify dominant frequencies in ordered observations.
- A fast Fourier transform converts time-ordered observations into a power spectrum so a cycle length can be read from frequency and reused as an indicator parameter.
- Valid construction removes any trend longer than the sample, applies a Hanning window, and pads the array to a power of two such as 64, 128, or 256.
- Once a cycle length is measured, a moving-average cutoff can be set at half that length so shorter fluctuations are treated as noise.
The transform as a construction bench
The editorial reading is that a fast Fourier transform is a construction bench for cycle-aware lookbacks, not a display that already contains a completed signal.
Fourier analysis reconstructs a complex series as a sum of sinusoids, each defined by amplitude, frequency, and phase. Spectral analysis is treated as the same construction as Fourier analysis and is used to identify dominant frequencies or frequency bands in ordered observations.
A fast Fourier transform converts time-ordered observations into a power spectrum whose horizontal axis is frequency and whose vertical axis is cycle power. The power spectrum is a frequency-versus-power plot produced after superimposed cycles have been separated.
Detrend, taper, and pad
Valid construction requires removing any trend longer than the sample, forcing similar start and end values with a Hanning window, and padding the array to a power of two such as 64, 128, or 256.
Detrending removes a component longer than the sample, often by subtracting a linear fit or a moving average, before the transform is run. The Hanning window is a preprocessing taper that forces similar start and end values so endpoint jumps do not distort the transform.
After the Hanning window is applied, peak power remains at the same frequencies even though extra energy appears beside those peaks.
Price series complicate the construction because they trend, need not be periodic, and contain weekend and holiday gaps that can hide parts of a cycle.
Read cycle length from frequency
With a 260-session year, period equals 260 divided by frequency, so a frequency of 20 cycles per year maps to a 13-session period.
In a 64-point summed-wave example, one cycle per window corresponds to a 64-period length and five cycles per window corresponds to a 12.8-period length.
A displayed price series resolved into three ranked cycles of 341, 64, and 102 sessions, with the strongest component shown first.
Convert the peak into a cutoff length
Once a cycle length is read from the transform, a moving-average cutoff can be set at half that length so shorter fluctuations are treated as noise.
The editorial construction reuses that cutoff length as the indicator window, so the measured cycle becomes a lookback instead of remaining only a peak on the power spectrum.
Ford FFT cycles and the half-period indicator windows
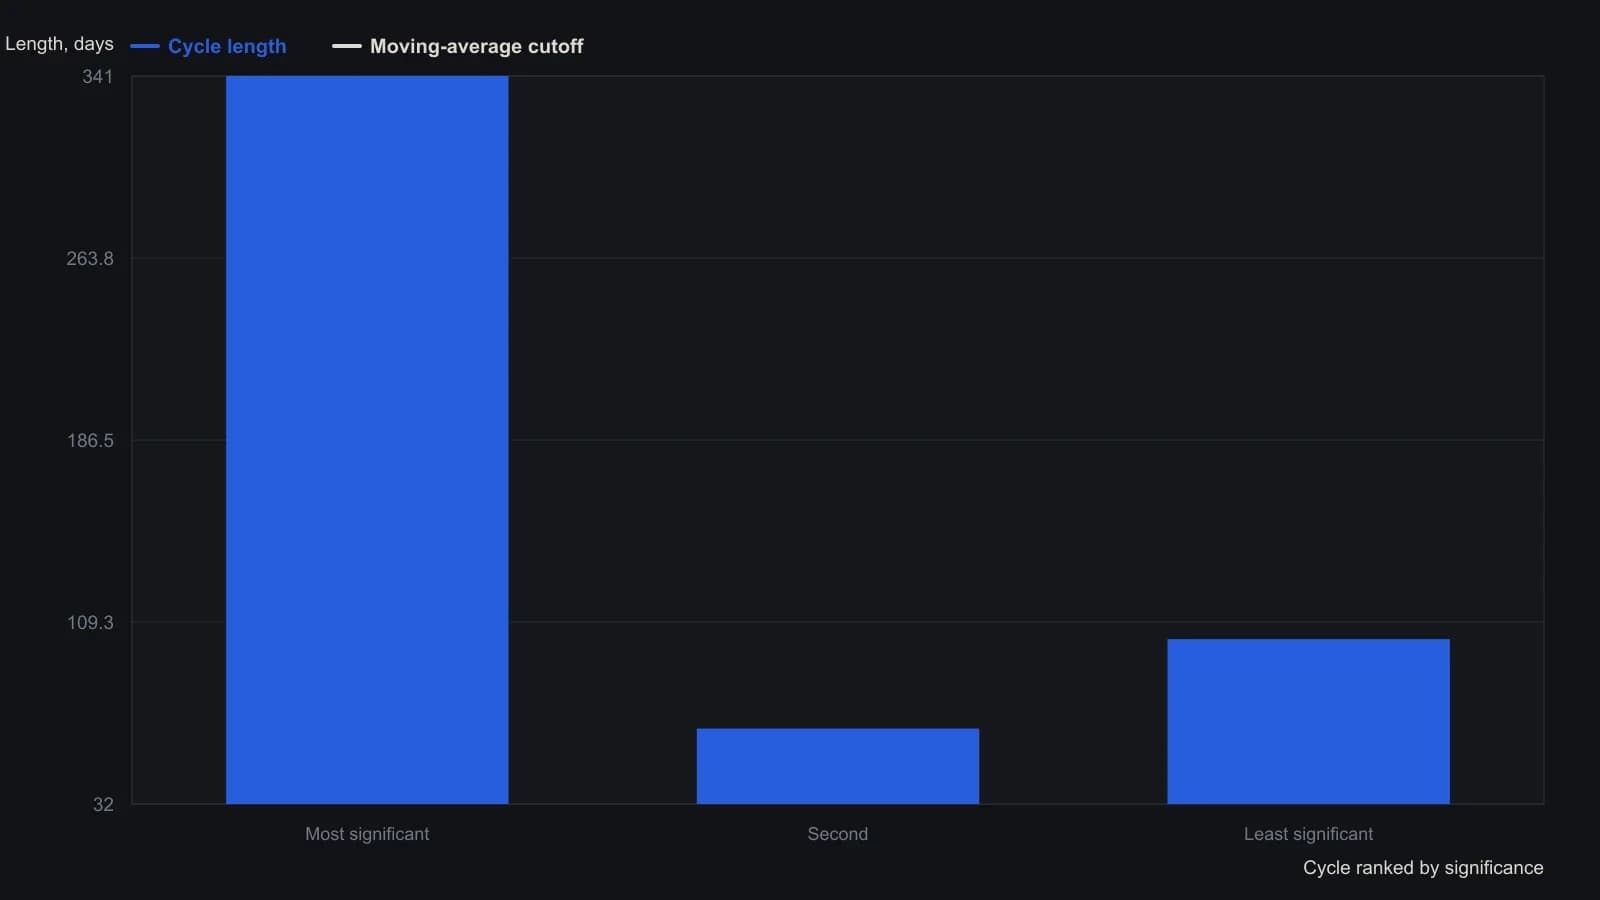
Cutoff length equals cycle length divided by two, the article's rule for a noise-rejecting moving average. A 341-day cycle is longer than one year of daily bars; the sidebar warns that a cycle longer than the sample can skew the spectrum unless the series is detrended first.
All readings on this track · 16 readings
- 1982Building FFT spectra to size cycle filters
- 1988Fourier cycle models break in major swings
- 1988Constructing moving average filters from price Fast Fourier Transforms
- 1989Staging Fast Fourier construction under memory limits
- 1993Constructing forecast inputs with moving averages, Fourier transforms and intermarket spreads
- 1994Preprocessing prices so Fourier peaks set moving-average lengths
- 1994Constructing a spreadsheet FFT power spectrum from daily prices
- 1994Building dominant-cycle spectra with FFT preprocessing
- 1994Constructing labeled cycle lengths from FFT spectra
- 1999Fast Fourier Transform reconstruction is not a walk-forward decision tool
- 1999Walk-forward endpoint Fourier construction as a same-day mechanical procedure
- 2002From the power spectrum to indicator windows
- 2003Endpoint Fast Fourier Transform evaluation with walk-forward mechanical rules
- 2004Constructing signal and noise from market waveforms
- 2012A two-stage case study in market cycle analysis
- 2015Whitening pink noise to build a near-zero-lag cycle oscillator