1994issue C041-5
Building dominant-cycle spectra with FFT preprocessing
A fast Fourier transform turns a prepared ordered series into a power spectrum. On a two-sine teaching window the recovered peaks sit at frequencies 1 and 5, and the higher-power peak is the dominant cycle.
- A price path can be treated as a trend plus longer and shorter cycles added together, which produces countertrend pauses inside both advances and declines.
- A fast Fourier transform recasts an ordered series into a frequency series whose height is cycle power, and that display is the power spectrum.
- Before the transform, remove a drift longer than the window, apply a Hanning taper so the ends meet, and pad with zeros to a power-of-two length.
- On the prepared two-sine composite, spectral analysis recovers frequencies of 1 and 5, and the higher-power peak is the dominant cycle.
Trend plus cycles in a price path
A price path can be treated as a trend plus longer and shorter cycles added together, which produces countertrend pauses inside both advances and declines. Cycle length is the reciprocal of frequency: how many sampling intervals complete one oscillation.
A two-sine teaching window
In a 64-observation teaching series, one sine completes one cycle per window (length 64 if each point is a day) and the other completes five cycles (length 12.8).
Building the power spectrum
A fast Fourier transform is an algorithm that recasts an ordered series from time into frequency so each periodic component is scored by power. The height of that frequency series is cycle power, which is how a power spectrum is constructed. Spectral analysis then reads cycle strength across frequencies after the prepared series has been transformed out of the time domain.
Power spectrum of the two-sine teaching window
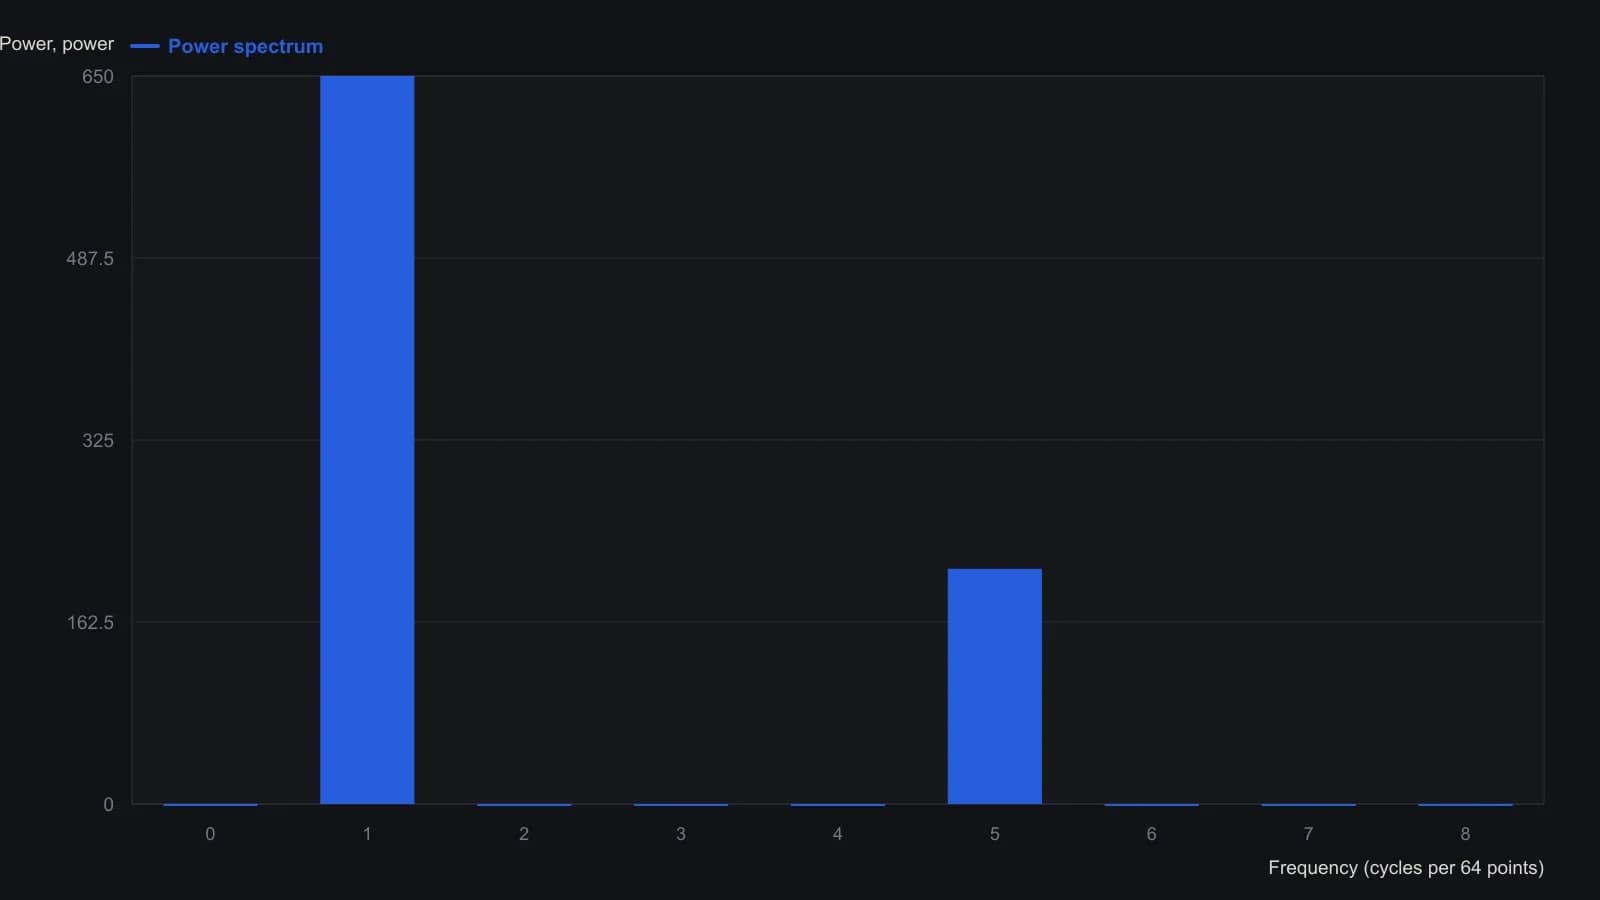
Y-axis numerals on the scan are hard to read, so power is approximate. Empty frequency bins are treated as zero power, matching the printed bars.
Detrend before the transform
A trend longer than the sample must be removed before the transform, for example by subtracting a linear least-squares fit, or the power spectrum is skewed. Detrend is that removal of a drift longer than the analysis window so the drift does not warp the spectrum.
Match the ends with a Hanning window
The algorithm treats the window as if it repeats, so start and end levels should match. A Hanning window is a taper that forces the sample ends to meet so a jump at the wrap-around does not leak into the spectrum. Hanning tapering adds side energy around true peaks, but the teaching composite still shows its peak power at frequencies 1 and 5.
Pad to a legal length
The input length must be a power of two such as 64, 128, or 256. Zero-padding appends zeros until the array length is a power of two, which the transform requires, when the observed sample is shorter.
The dominant cycle is the higher-power peak
Spectral analysis of the two-sine composite recovers frequencies of 1 and 5, and the higher-power peak is the dominant cycle. That frequency is the leading periodic component of the prepared window.
All readings on this track · 16 readings
- 1982Building FFT spectra to size cycle filters
- 1988Fourier cycle models break in major swings
- 1988Constructing moving average filters from price Fast Fourier Transforms
- 1989Staging Fast Fourier construction under memory limits
- 1993Constructing forecast inputs with moving averages, Fourier transforms and intermarket spreads
- 1994Preprocessing prices so Fourier peaks set moving-average lengths
- 1994Constructing a spreadsheet FFT power spectrum from daily prices
- 1994Building dominant-cycle spectra with FFT preprocessing
- 1994Constructing labeled cycle lengths from FFT spectra
- 1999Fast Fourier Transform reconstruction is not a walk-forward decision tool
- 1999Walk-forward endpoint Fourier construction as a same-day mechanical procedure
- 2002From the power spectrum to indicator windows
- 2003Endpoint Fast Fourier Transform evaluation with walk-forward mechanical rules
- 2004Constructing signal and noise from market waveforms
- 2012A two-stage case study in market cycle analysis
- 2015Whitening pink noise to build a near-zero-lag cycle oscillator