2003issue C011-7
Endpoint Fast Fourier Transform evaluation with walk-forward mechanical rules
A Fast Fourier Transform fitted to a completed price window can appear to lead a major high while only reconstructing history. Endpoint construction, a mechanical trading system, and walk-forward analysis turn the same spectral tool into a testable, non-overnight evaluation procedure.
- A noise-filtered Fourier curve fitted to a completed price window can appear to lead a major high, while the same transform computed only through that high can point the opposite way.
- Endpoint construction keeps only the last filtered transform value as a sliding window advances one bar at a time, matching what would have been visible in real time.
- Unflattened first and last prices can inject wraparound distortion at the endpoint, so flattening reduces that wraparound at the cost of a low-frequency spectral artifact.
- A mechanical trading system on the endpoint series can flatten before the close and be evaluated with walk-forward analysis, because one-minute e-mini dynamics were described as shifting.
A noise-filtered Fourier curve fitted to a completed price window can appear to lead a major high, while the same transform computed only through that high can point the opposite way. That contrast is the starting point for evaluating a Fast Fourier Transform as a real-time tool rather than as a retrospective fit.
Noise-filtered FFT fitted through the July 1998 S&P high
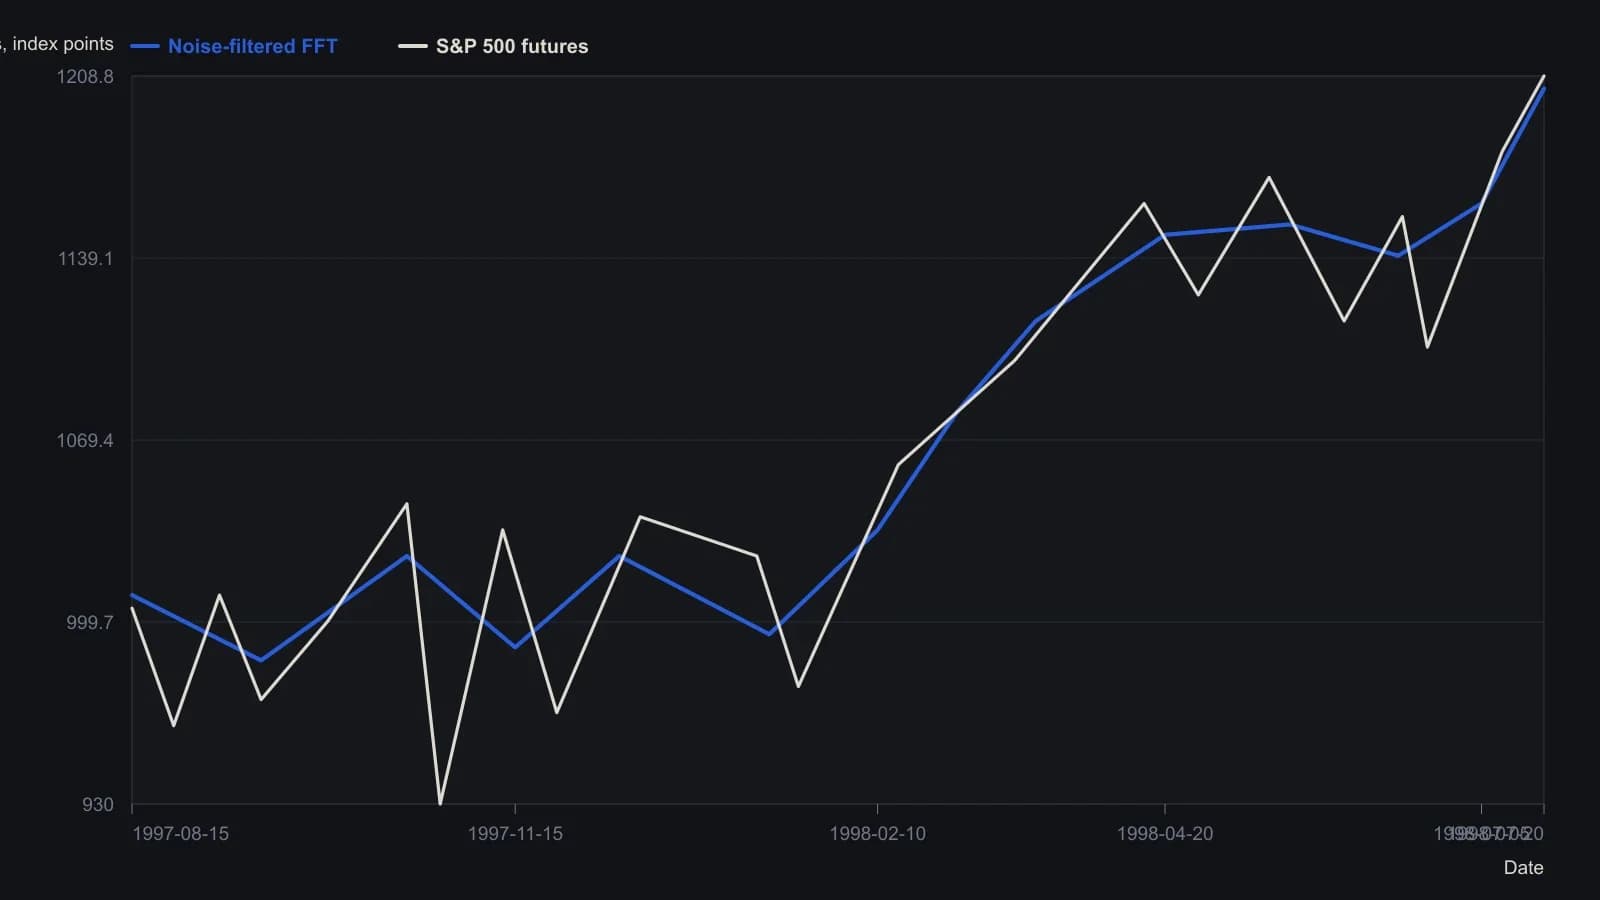
The red overlay is a full-window noise-filtered FFT, not the endpoint walk-forward series introduced later in the article. Turning-point readings are approximate because they were taken off the published raster.
What endpoint construction keeps
Endpoint construction keeps only the last filtered transform value as a sliding window advances one bar at a time, so the resulting curve matches what would have been visible in real time rather than a retrospective full-sample fit.
On the illustrated daily comparison, the endpoint curve lagged major turning points by zero to four days instead of leading price the way the full-window fit appeared to.
Wraparound at the value being estimated
A discrete transform treats a finite sample as periodic, so unflattened first and last prices can inject wraparound distortion precisely at the endpoint that the procedure is trying to estimate.
Endpoint flattening subtracts a linear ramp so the first and last samples become zero, reducing wraparound while adding a low-frequency artifact to the spectrum.
From the endpoint series to a mechanical trading system
The one-minute construction used a 512-bar log-price window, a magnitude threshold that zeroes weaker frequencies, an inverse transform, and a summed successive-endpoint change series to damp window-to-window jumps.
The mechanical trading system buys after the endpoint series rises more than a long threshold from its short-side low, sells after it falls more than a short threshold from its long-side high, and flattens one minute before the session close so no overnight position remains.
Walk-forward analysis as the evaluation frame
Walk-forward analysis was chosen because one-minute e-mini dynamics were described as shifting with news, sentiment, and calendar effects, so parameters from months earlier may not represent the current window.
In the reported one-week holdout, average winners, losers, and drawdowns were described as similar to the four-week test segment, which the author treated as evidence that the test window captured the next week's intraday dynamics.
The same holdout favored shorts during an almost 8 percent decline, still captured a late-session rally, and was presented as needing 10 to 20 additional test and holdout windows before the result could be treated as more than chance.
All readings on this track · 16 readings
- 1982Building FFT spectra to size cycle filters
- 1988Fourier cycle models break in major swings
- 1988Constructing moving average filters from price Fast Fourier Transforms
- 1989Staging Fast Fourier construction under memory limits
- 1993Constructing forecast inputs with moving averages, Fourier transforms and intermarket spreads
- 1994Preprocessing prices so Fourier peaks set moving-average lengths
- 1994Constructing a spreadsheet FFT power spectrum from daily prices
- 1994Building dominant-cycle spectra with FFT preprocessing
- 1994Constructing labeled cycle lengths from FFT spectra
- 1999Fast Fourier Transform reconstruction is not a walk-forward decision tool
- 1999Walk-forward endpoint Fourier construction as a same-day mechanical procedure
- 2002From the power spectrum to indicator windows
- 2003Endpoint Fast Fourier Transform evaluation with walk-forward mechanical rules
- 2004Constructing signal and noise from market waveforms
- 2012A two-stage case study in market cycle analysis
- 2015Whitening pink noise to build a near-zero-lag cycle oscillator