2018issue C0928-31
Evaluating double-bottom breakouts as a testable system
The archive locked a double bottom into one breakout-system, then changed a single exit or structure rule at a time. The question was whether the same sequence still earned its keep after each change, not whether a two-trough sketch looks familiar.
- A double-top-bottom is a long hypothesis only after coded trough rules and a daily close through the neckline, with entry on the next open.
- The same S&P 500 rules produced a higher profit factor, win rate, average trade, win/loss ratio, and Kelly value, plus a smaller maximum drawdown, than the Russell 3000 run, even though the broader universe booked a larger total dollar profit from more trades.
- Left-trough-higher patterns and right-trough-heavier volume scored better on the same reliability measures. A two-height take-profit with a stop just under the neckline left a low Kelly value and was not presented as a recommended pair.
- Height bands relative to price showed no monotonic size effect, and holding time after entry was about 32 to 33 days in both universes.
From a two-trough sketch to one sequence
A double-top-bottom is a two-trough or two-peak price structure that becomes a long or short hypothesis only after a defined breakout through the intervening extreme. The archive studied the long case as a breakout-system: a complete entry, exit, and abstention procedure that turns the chart condition into one testable sequence rather than a discretionary sketch.
Editorial reading: lock the pattern rules, vary one exit or structure choice at a time, and judge the setup by whether the same procedure still earns its keep after those changes.
How the double bottom was coded
A coded double-bottom required the structure to last no more than 90 trading days, placed the intervening high at least five days before the breakout, and limited the vertical gap between troughs to 10% of the pattern height.
The tested long signal was a daily close above the neckline, with entry on the next open and a stop a few cents under the lower trough. The baseline take-profit was the measure-rule: a take-profit placed one pattern height above the breakout price, used as the baseline reward target against which other exit multiples are compared.
The procedure traded only when the S&P 500 was treated as bullish. It skipped names under $5 or over $500 and names whose breakout-day volume was below 100,000. Commissions were ignored.
The same rules on two universes
On the January 2000 through mid-2017 window, the same S&P 500 rules produced a higher profit factor, win rate, average trade, win/loss ratio, and Kelly value, plus a smaller maximum drawdown, than the Russell 3000 run. The broader universe still posted a larger total dollar profit from more trades.
Profit factor here means gross profit divided by gross loss. It is used as a reliability score for the whole procedure, not as a forecast of future return. The Kelly criterion is a sizing filter that combines the share of winning trades with the average win-to-loss ratio so a procedure can be ranked before capital is committed.
Holding time after entry was nearly the same in both universes, about 32 to 33 days, so those universe-level differences were not explained by a different typical holding period.
What changed when one rule moved
Patterns with the left trough above the right trough outperformed the opposite height order. Patterns whose right trough carried more volume than the left trough also scored better on the same reliability measures.
Raising the take-profit to two pattern heights while cutting losses just under the neckline left a low Kelly value, so that exit pair was not presented as a recommended combination.
Splitting patterns into small, medium, and large height bands relative to price produced no monotonic size effect. Most detections were small because the lookback was 90 days, and the largest band had too few trades for a firm ranking.
Editorial reading: universe choice, trough order, and the exit pair all moved the reliability scores, while holding time did not. The measure-rule remains the baseline against which those other exits were compared, not a claim about what a future double bottom will pay.
Profit factor after each double-bottom exit change
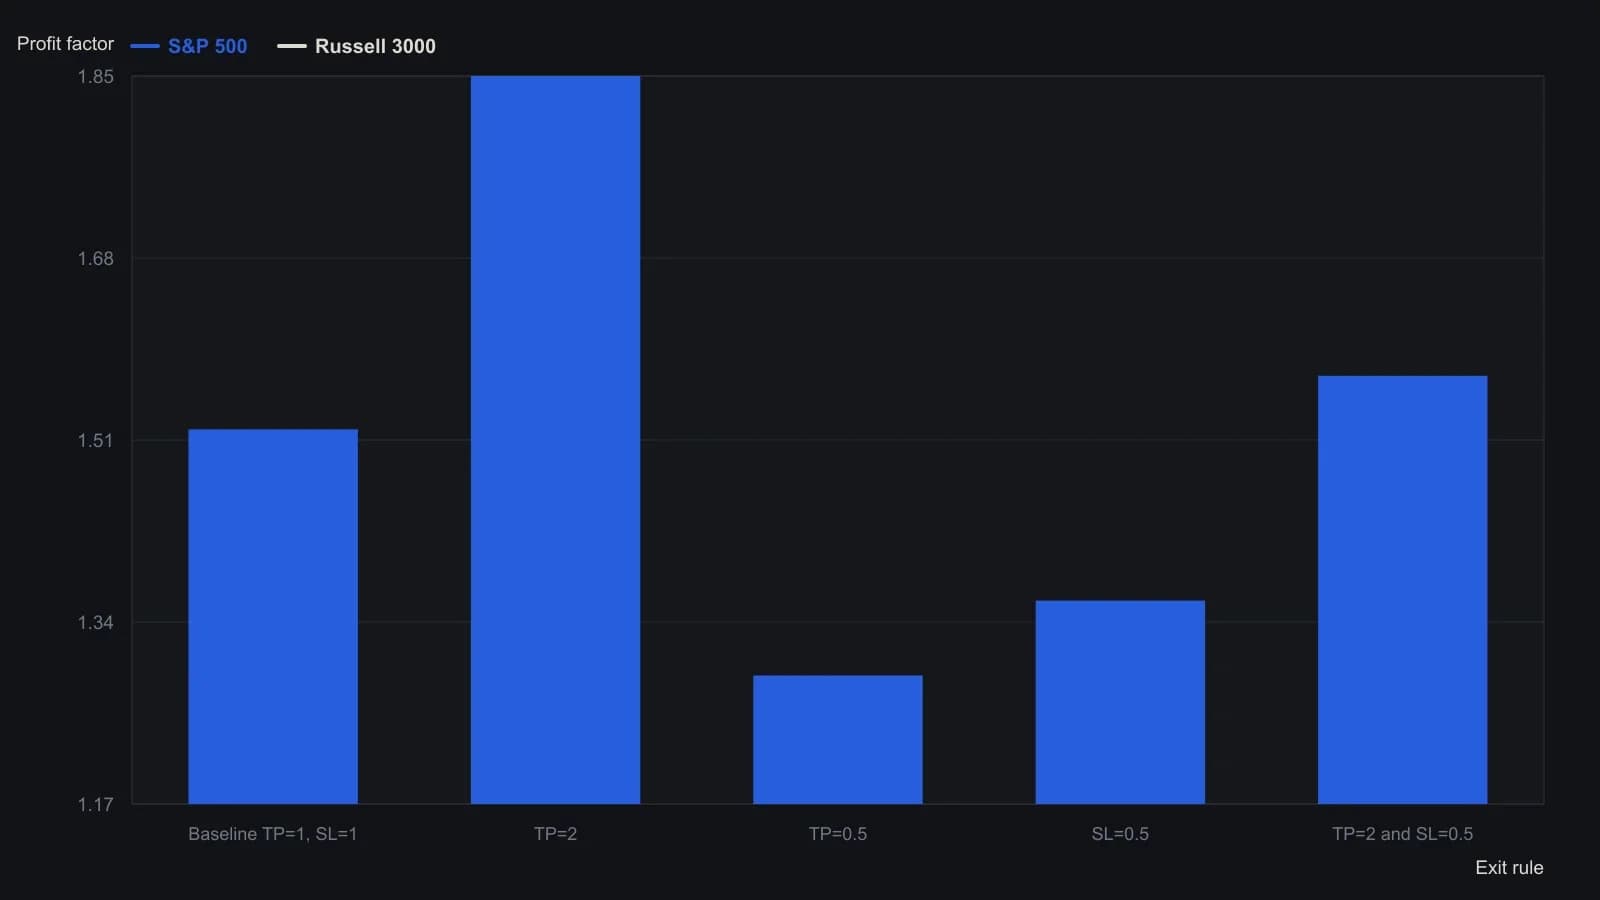
The coded double bottom could not last more than 90 trading days, the peak had to sit at least five days before the breakout, and the two troughs could not differ by more than 10% of pattern height. Trades ran only when the S&P 500 was bullish, used $10,000 per signal, ignored commissions, and skipped names with breakout-day volume under 100,000 or a price outside $5–$500. Exits were allowed through the end of 2017.
All readings on this track · 9 readings
- 1982Three gates for a futures book: equity risk, expected value, and shrinking pyramids
- 1995A Kelly-style leverage grid and reshuffled paths
- 2004Bound the loss before leverage changes size
- 2010Treat risk of ruin, drawdown limits, and Kelly sizing as consistent pre-trade filters
- 2010Fixed-fractional forex position sizing
- 2013Kelly fraction versus risk of ruin
- 2016Expected value versus leverage, drawdown, and Kelly sizing
- 2017Fixed-fraction sizing versus a theoretical pattern edge
- 2018Evaluating double-bottom breakouts as a testable system